This content originally appeared on Stefan Judis Web Development and was authored by Stefan Judis
I spent my Sunday reading the HTTP archive web almanac and shared the surprising and interesting pieces in a Twitter thread. I like to own my data – so here we have the thread on my own site. Enjoy!
Spending my Sunday morning reading the Web Almanac sharing internet stats and analyzing HTTP Archive data for 2019.
I'll share facts and stats that I think are interesting in a thread. ? :)
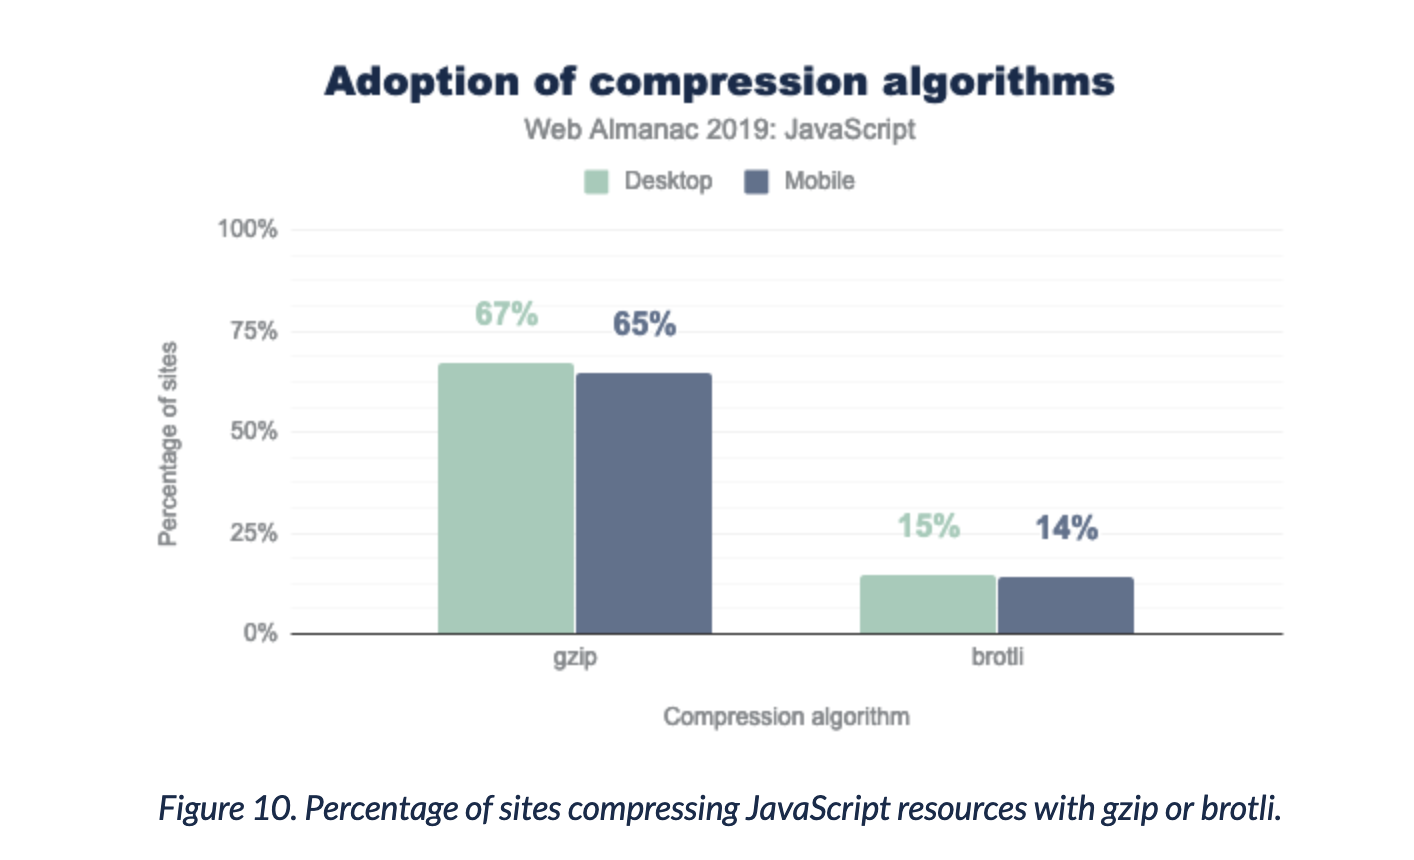
Only ~80% of sites compress their JavaScript files. ?
Section titled Only \~80% of sites compress their JavaScript files. ?
Edited: I tweeted initially that it's 65% because I missed the fact that gzip and brotli should count together. ?
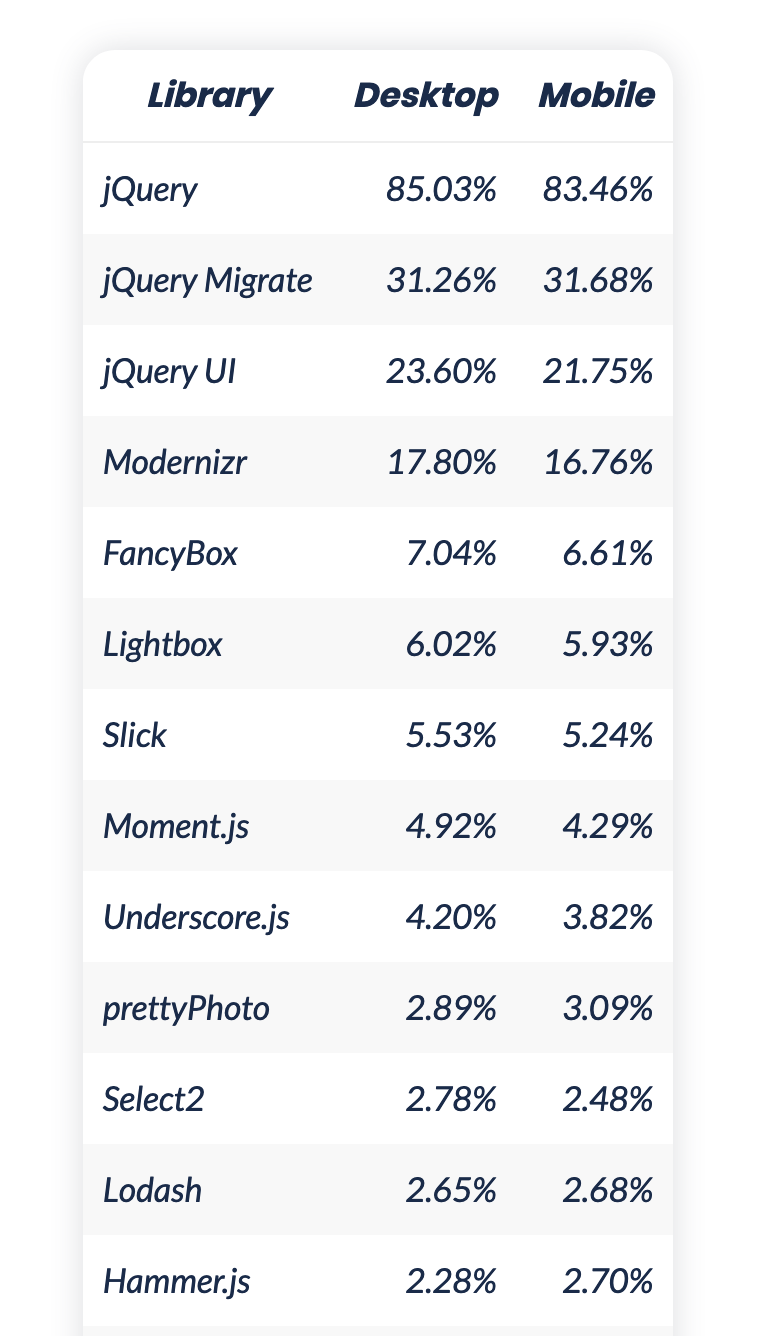
jQuery still powers 85% of the crawled sites
Section titled jQuery still powers 85% of the crawled sitesIt always feels like React/Vue/Angular are all over the internet – they're not... jQuery still powers 85% of the crawled sites. ?
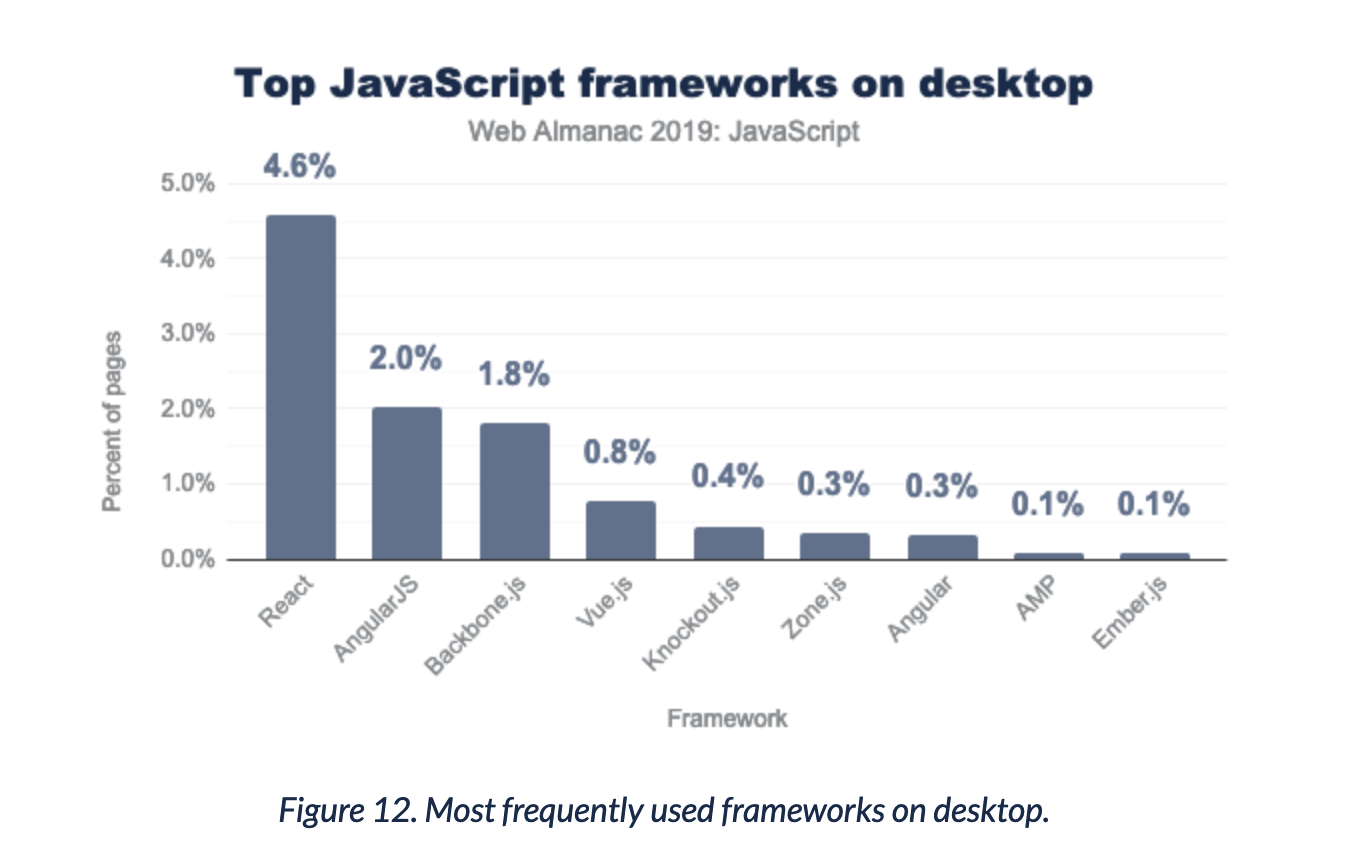
React powers 5% of the crawled sites
Section titled React powers 5% of the crawled sitesThe numbers for sites using "cutting-edge" frameworks are relatively low with React being the most popular with ~5% on desktop.
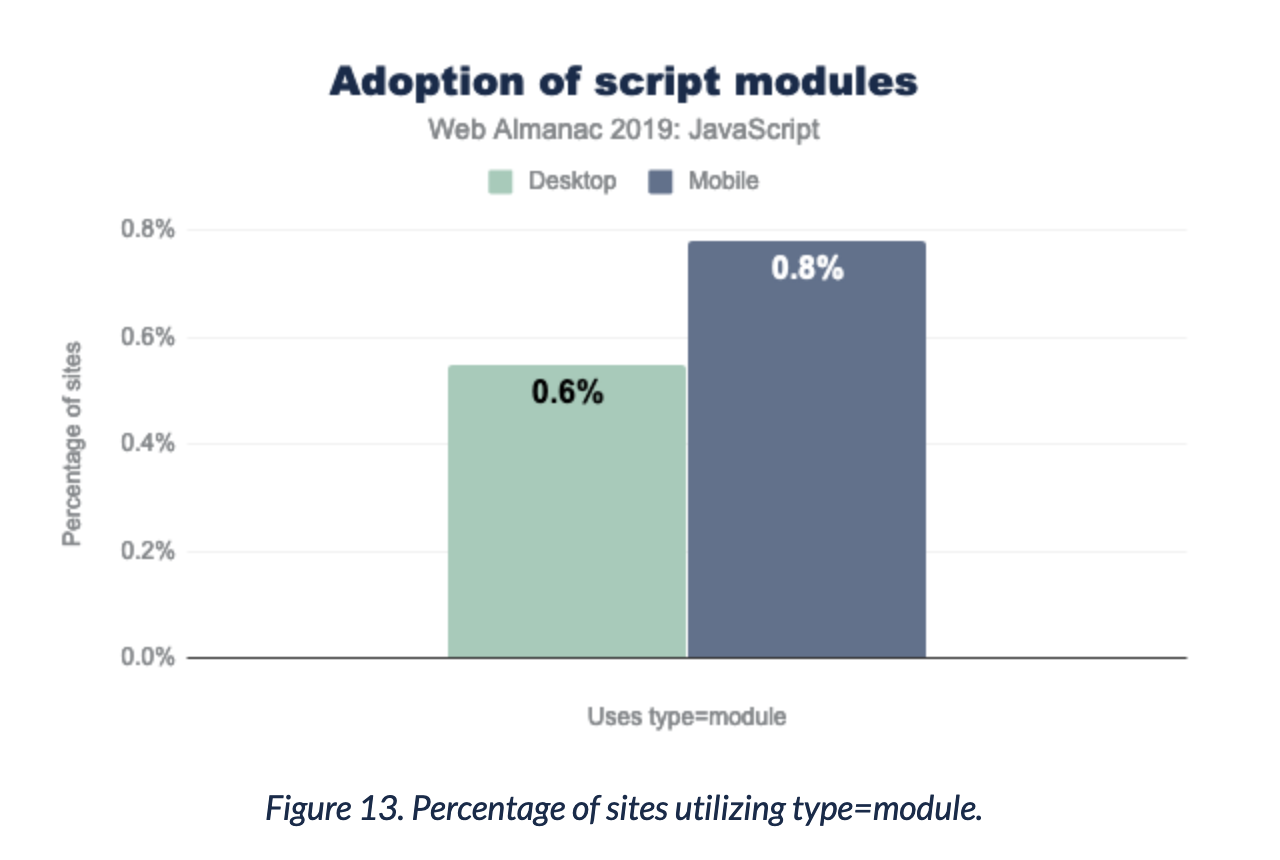
ES modules are barely used
Section titled ES modules are barely usedEven though the ES Module support is quite good these days they are not really used.
~1% is surprisingly low because you can use a fallback strategy shipping a single bundle using the `nomodule` attribute and use modules for supporting browsers today.
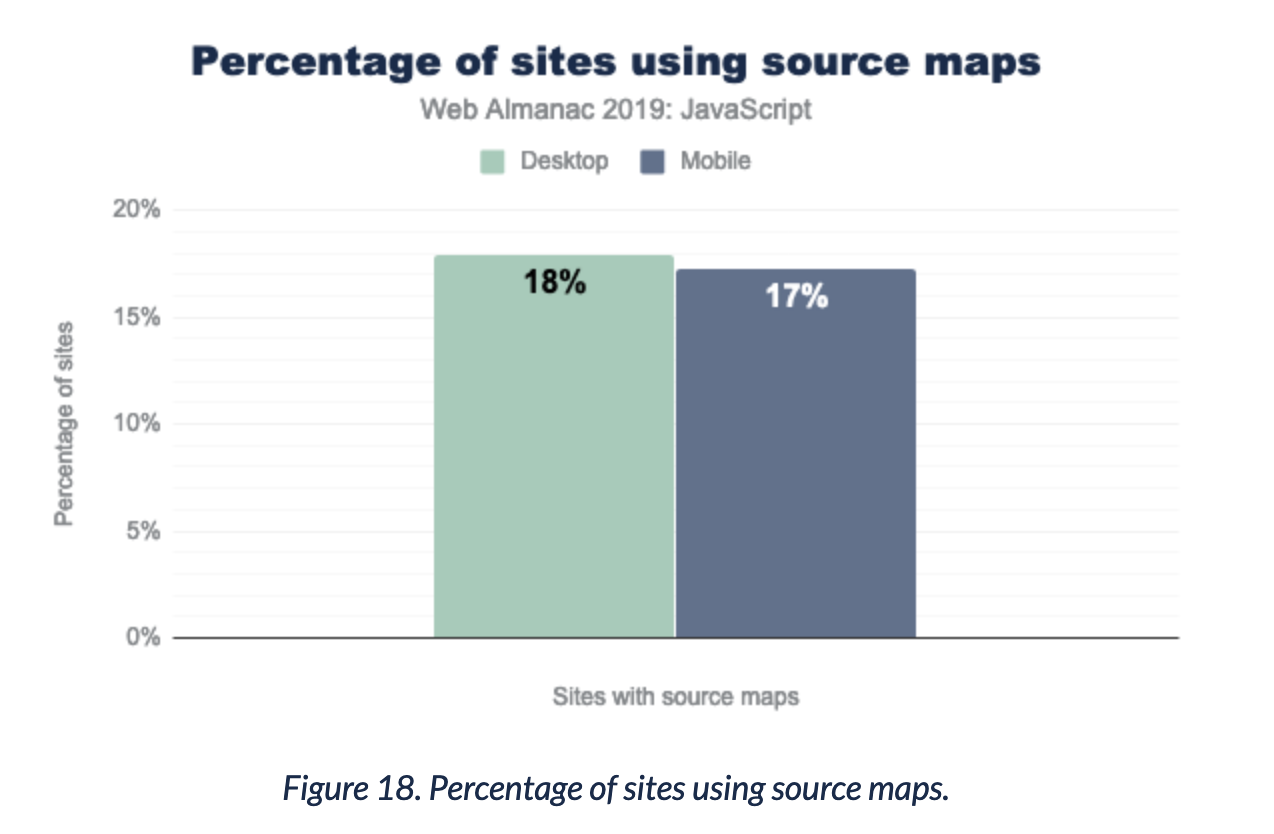
Low usage of source maps in production
Section titled Low usage of source maps in productionOnly ~20% of sites use source maps? ?
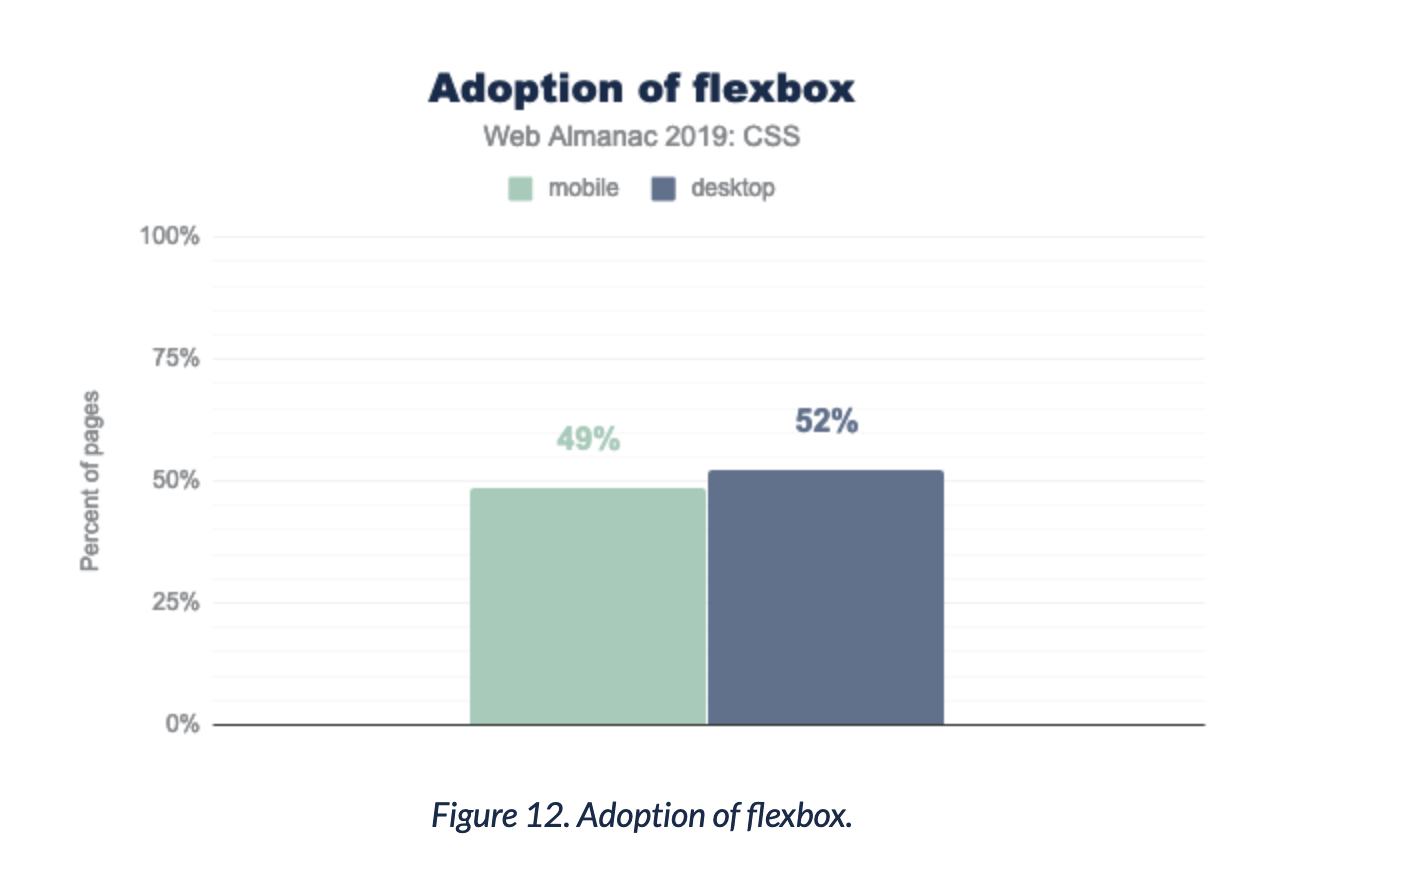
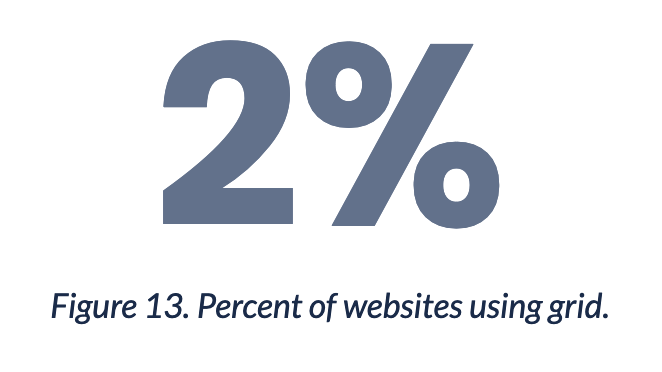
CSS flexbox and grid usage
Section titled CSS flexbox and grid usageRoughly 50% of sites use flexbox – only 2% use grid.
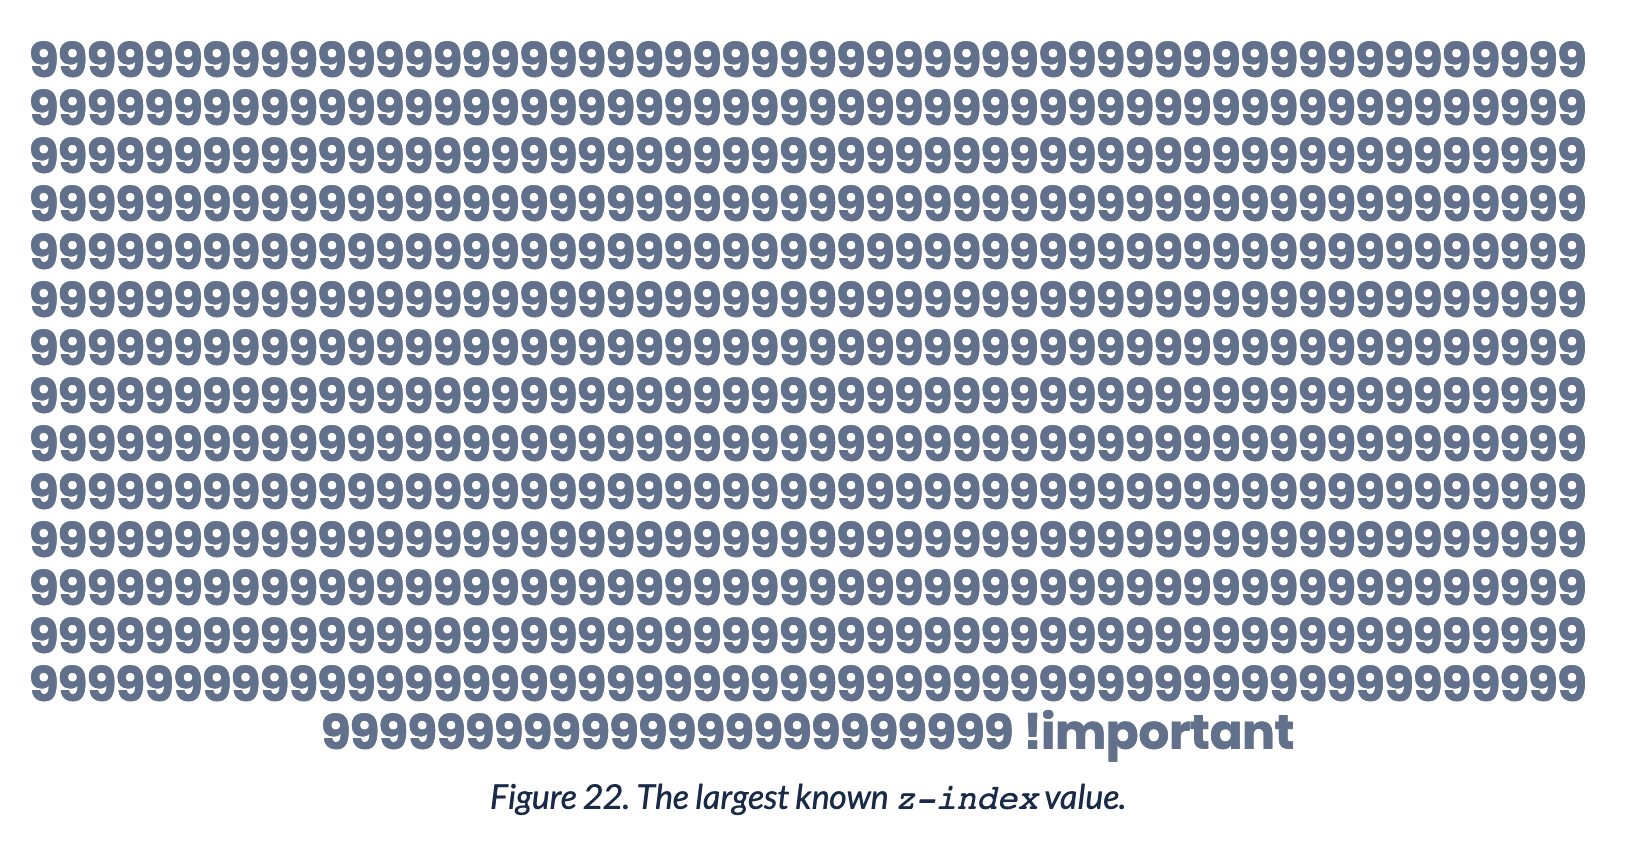
The highest found z-index value
Section titled The highest found z-index value
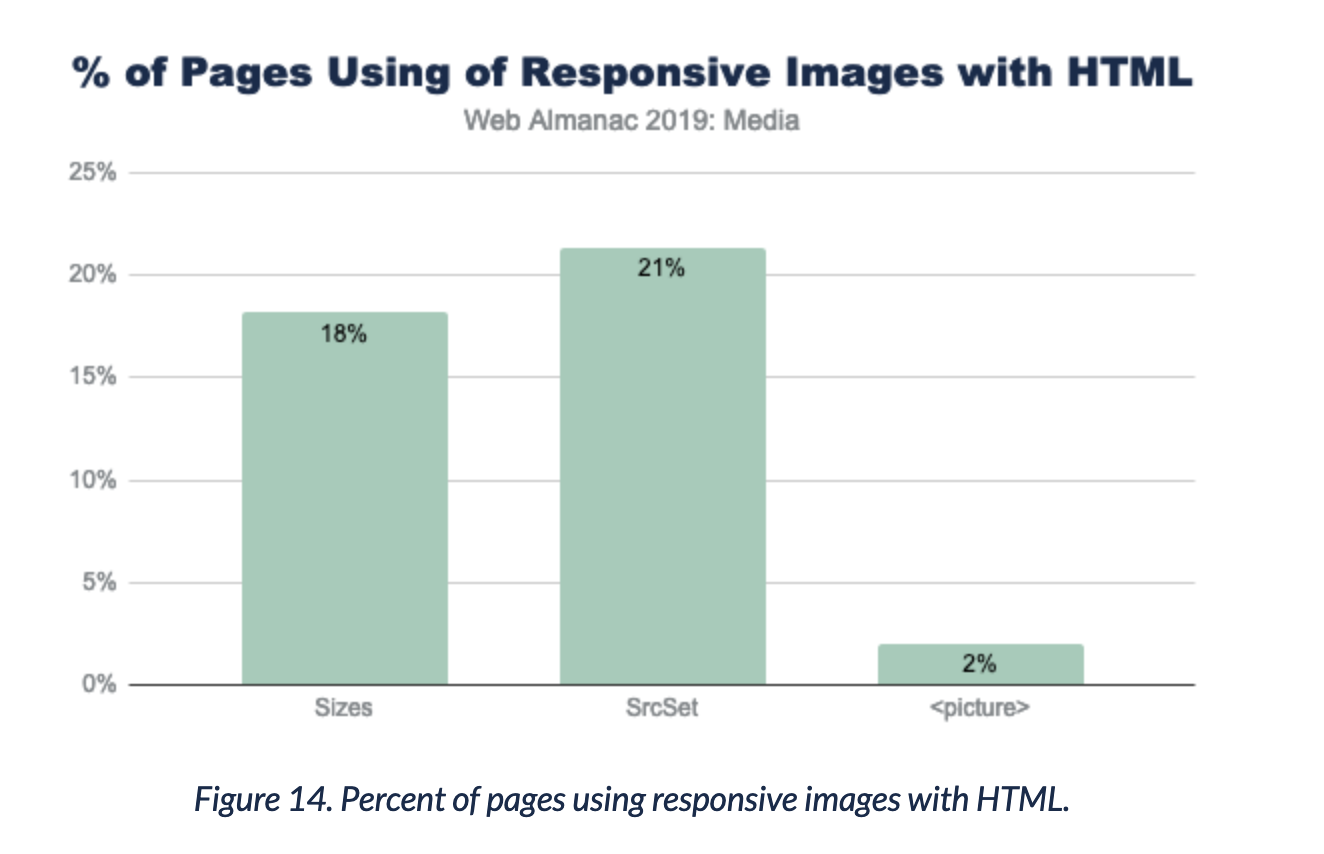
Usage of responsive images
Section titled Usage of responsive imagesOnly 20% of sites make use of responsive images...
Usage of the alt attribute on images
Section titled Usage of the alt attribute on imagesNo surprise here, but yeah... image alt attributes are not used as much as they should. :/
Edited: As Boris Schapira pointed out, images can be hidden from assistive technology by providing an empty alt attribute (alt=""). This fact was not taken into consideration by the Almanac and makes the statistic meaningless.
Usage of font-display
Section titled Usage of font-display26% of the pages use font-display. ? That's surprisingly high in my opinion. Because the support is not super-duper yet. I wonder how big google fonts' influence is in this trend. ?
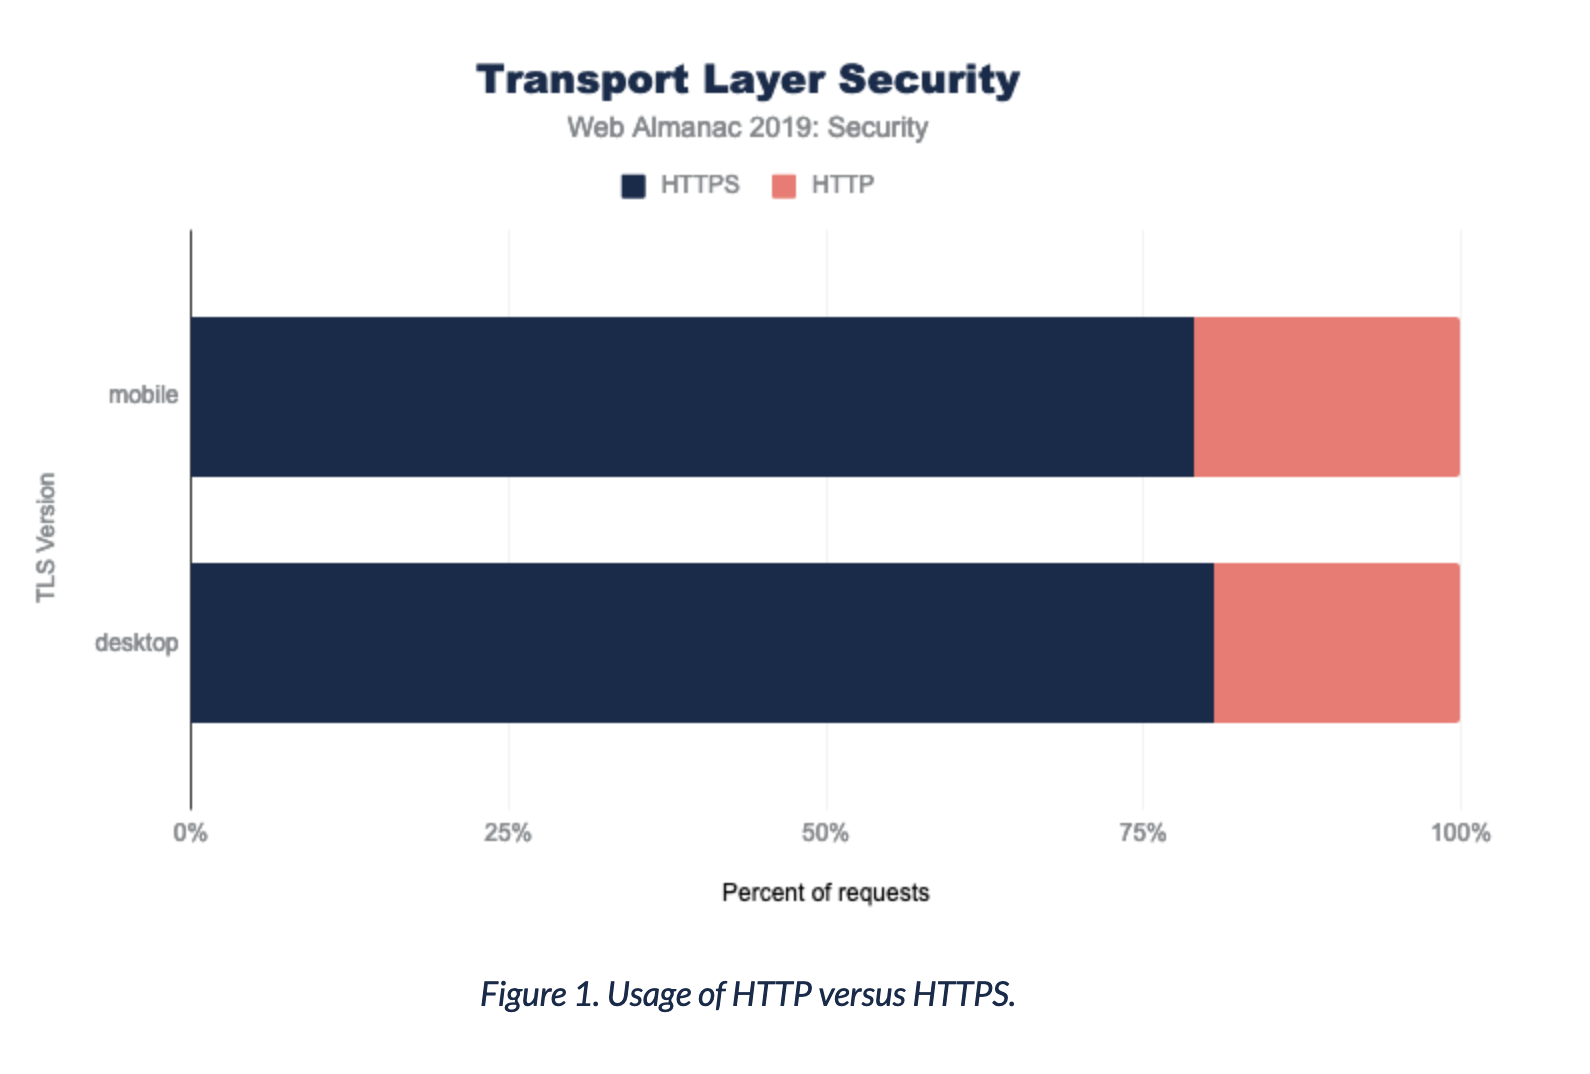
HTTPS adoption
Section titled HTTPS adoptionHonestly, I expected fewer sites being served over a secure connection. 80% of sites ship with https these days.
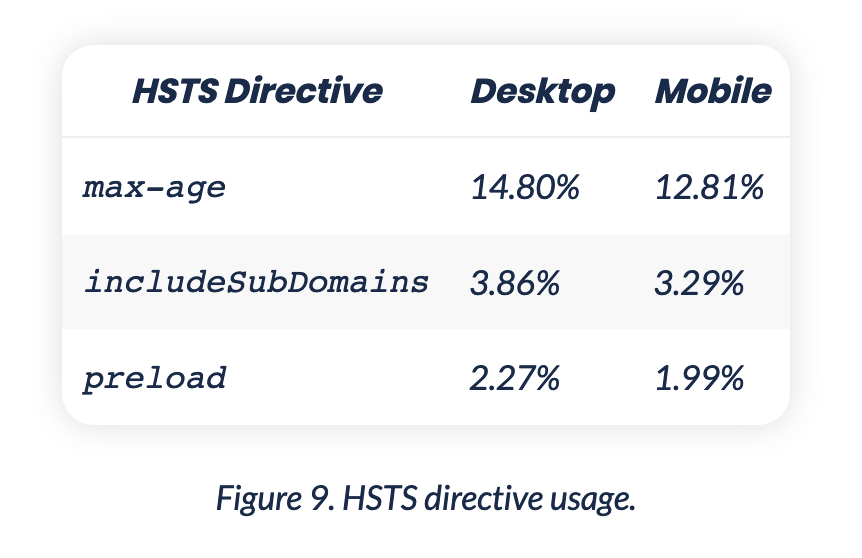
HSTS adoption
Section titled HSTS adoption12 - 14% of sites use HSTS to ensure they are only accessible by supporting browsers via HTTPS. This is also higher then I expected. ?
CSP adoption
Section titled CSP adoptionI got this statistic by myself recently, but it's still sooooo low. ?
Only roughly 5% of crawled sites use Content-Security-Policy (CSP).
The state of contrast issues
Section titled The state of contrast issues4 of 5 sites ship with color contrast issues. I really wish that we get better at this. :/
The often missing language attribute
Section titled The often missing language attribute26% of the pages don't specify the language of their content. This can trouble text-to-speech technology like screenreaders.
Accessible forms
Section titled Accessible forms4 of 5 forms don't ship with labels for their input elements. :/ I'm used to these bad numbers, but well... filling out forms can be tough for everybody (even tech people), we really have to get better at this. :/
Missing headings
Section titled Missing headings10% of sites ship without headings at all. ?
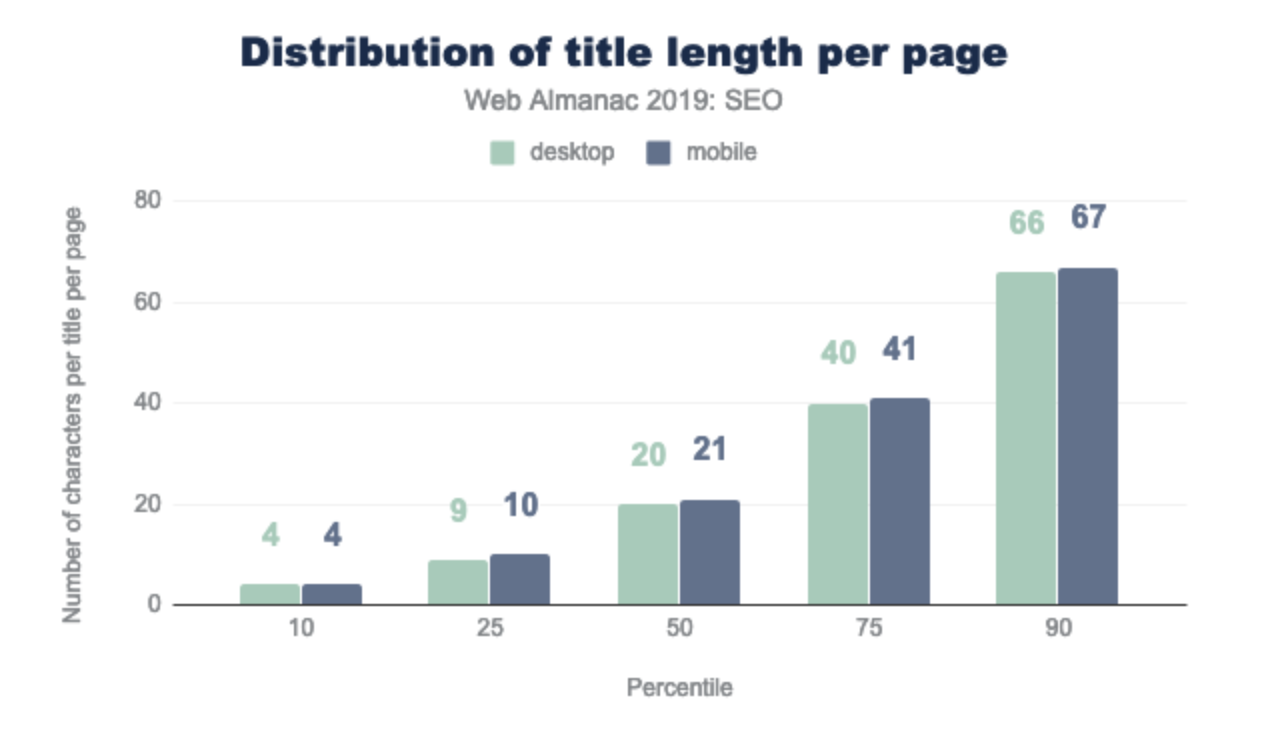
Too short title elements
Section titled Too short title elementsGoogle shows 50-60 characters in their search results. Generally speaking, the used title length is not optimal across the web. (at least for google)
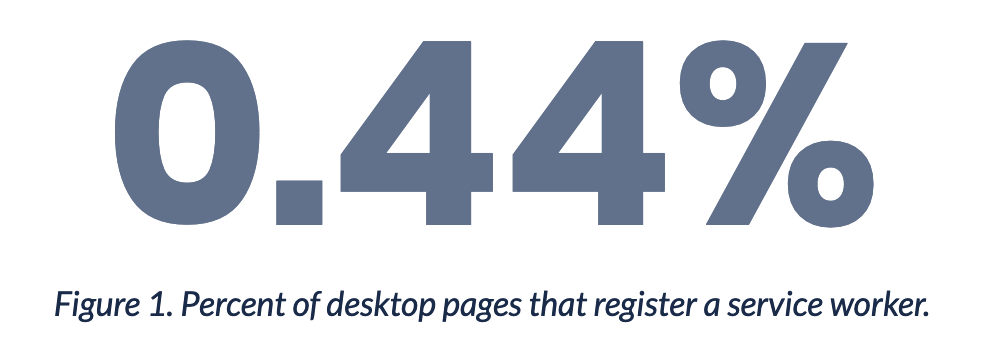
Service worker adoption
Section titled Service worker adoptionService workers are mainstream, right? ? Not really... Only 0.44% of the crawled sites register a service worker.
The jumpy state of websites
Section titled The jumpy state of websitesHow often do we click the wrong thing because something moved around? Too often.. Jumpy pages are the standard... :/
2 of 3 pages have a huge content shift while loading.
CLS stands for Cumulative Layout Shift – more info.
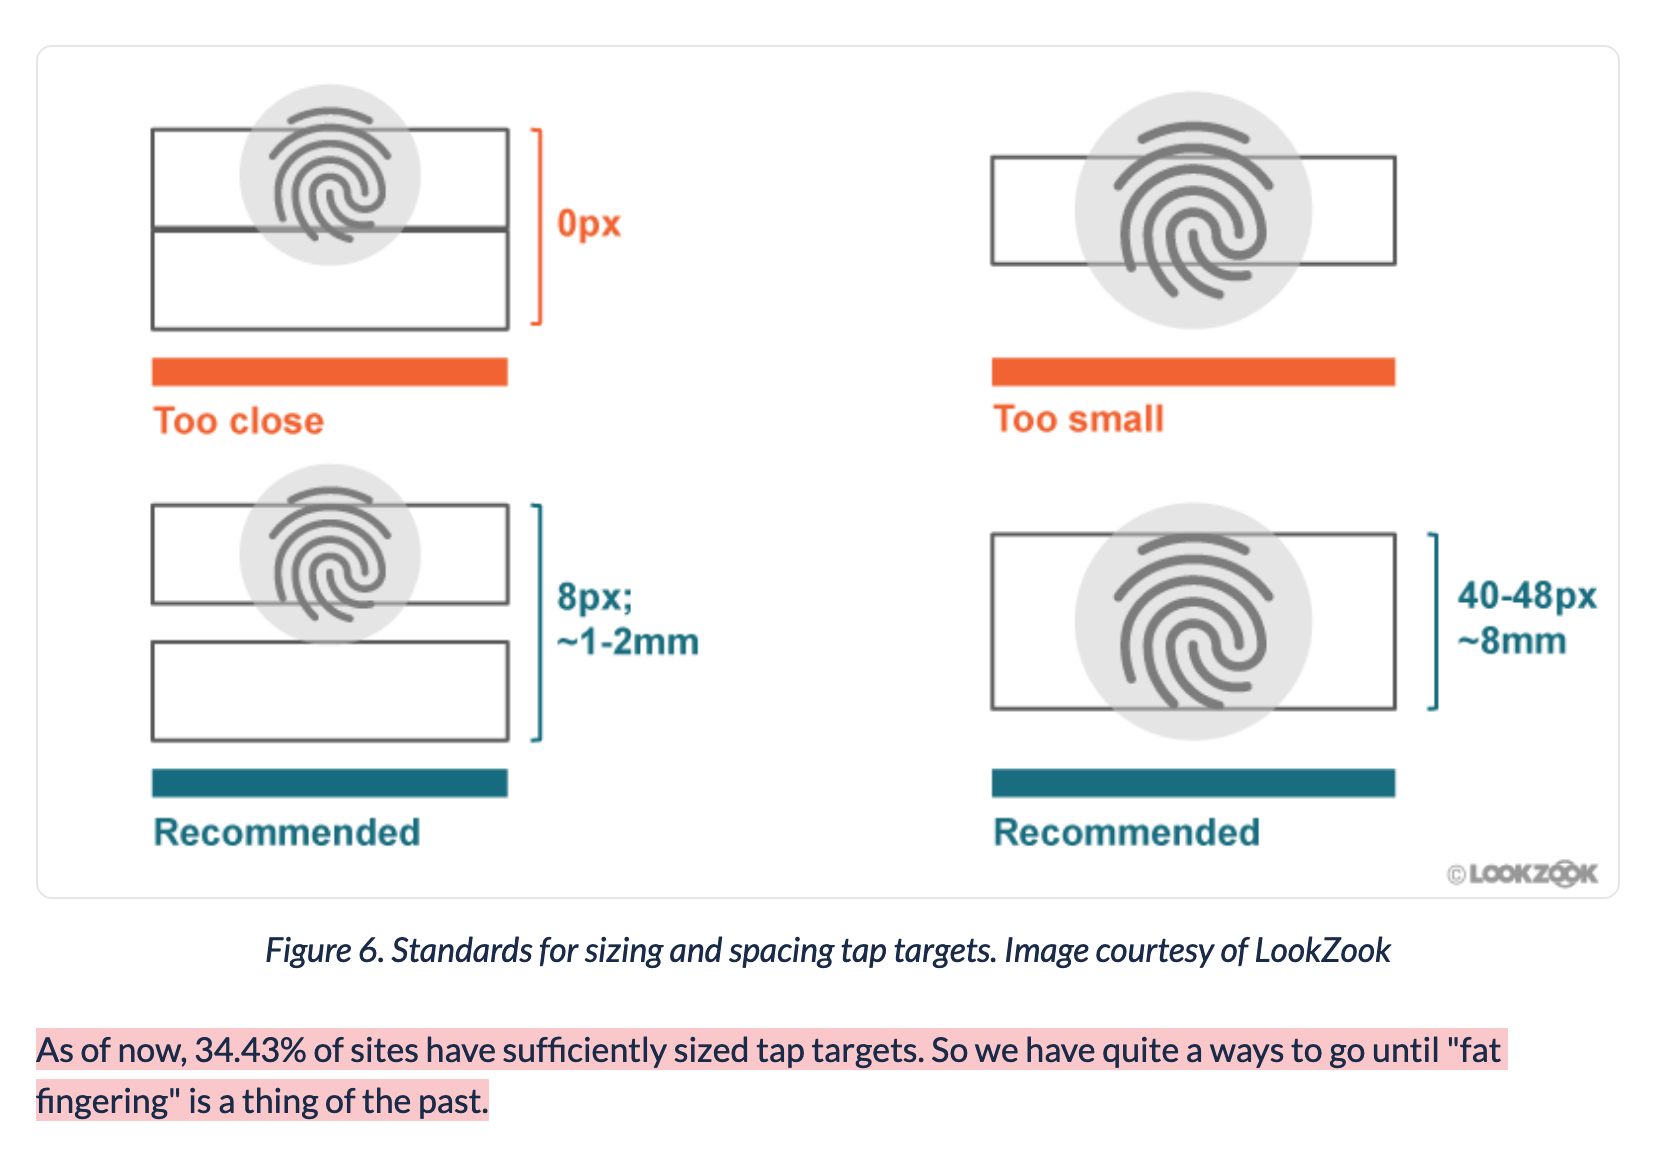
Big enough touch targets
Section titled Big enough touch targetsSpeaking about tapping the wrong thing. Only 34% of the pages include big enough buttons and links...
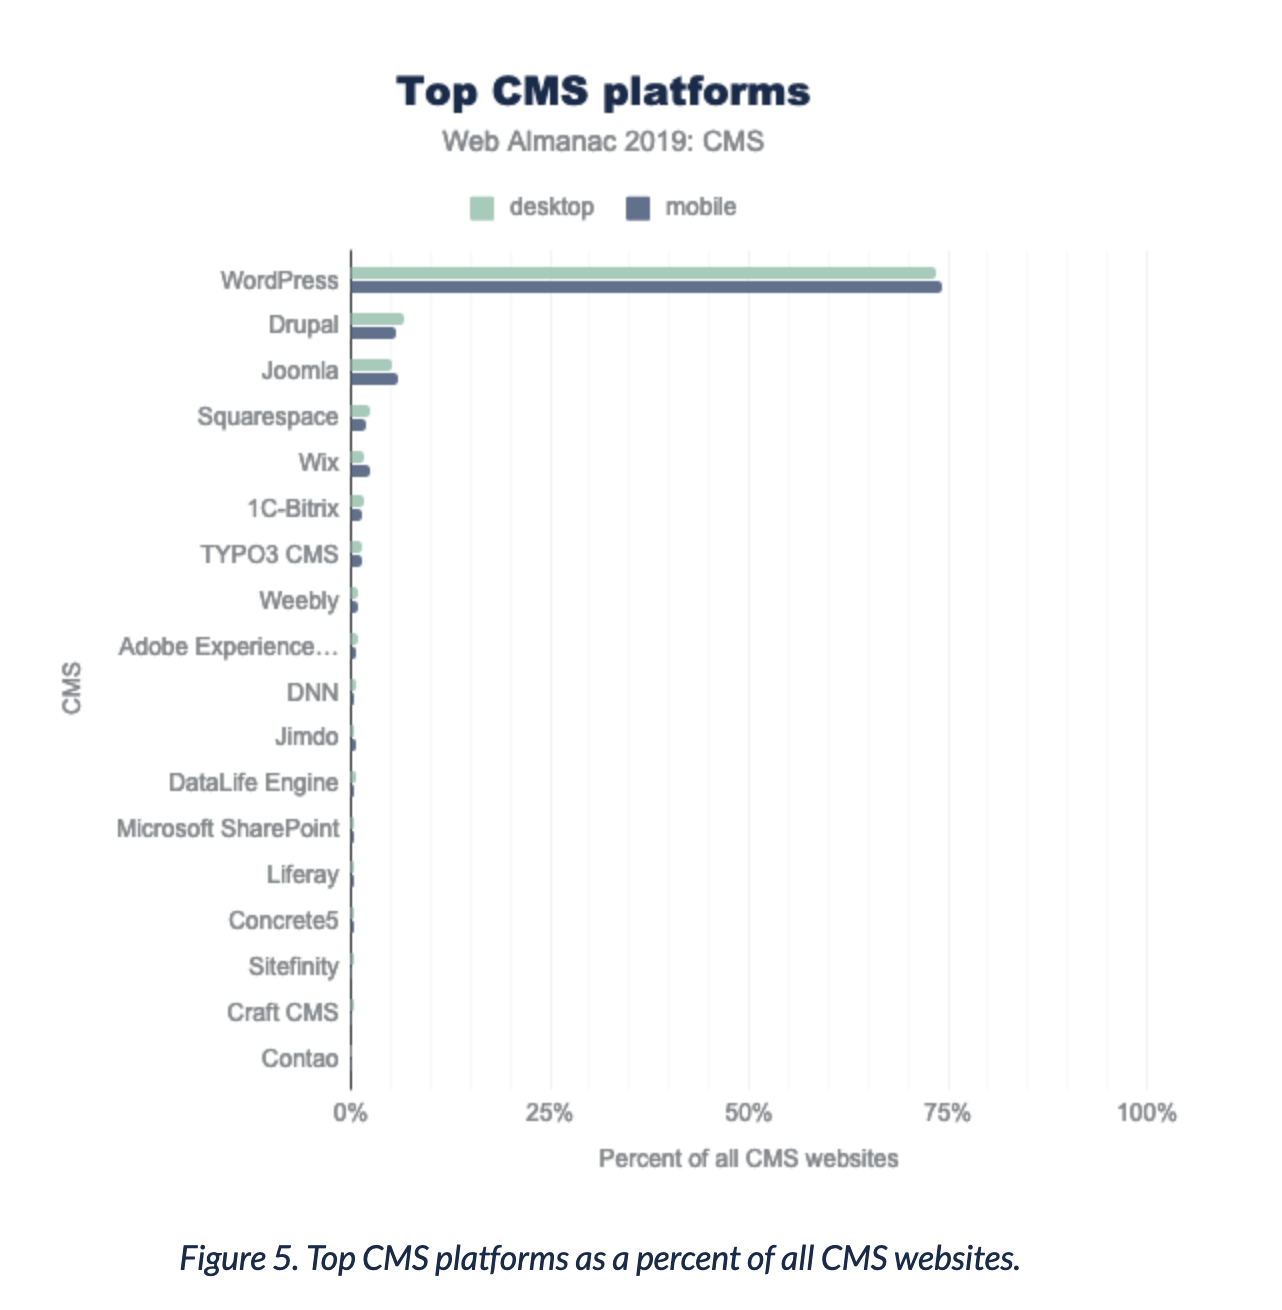
Wordpress' CMS domination
Section titled Wordpress' CMS dominationWordpress usage is still massive. 75% of sites using a CMS are running on wordpress.
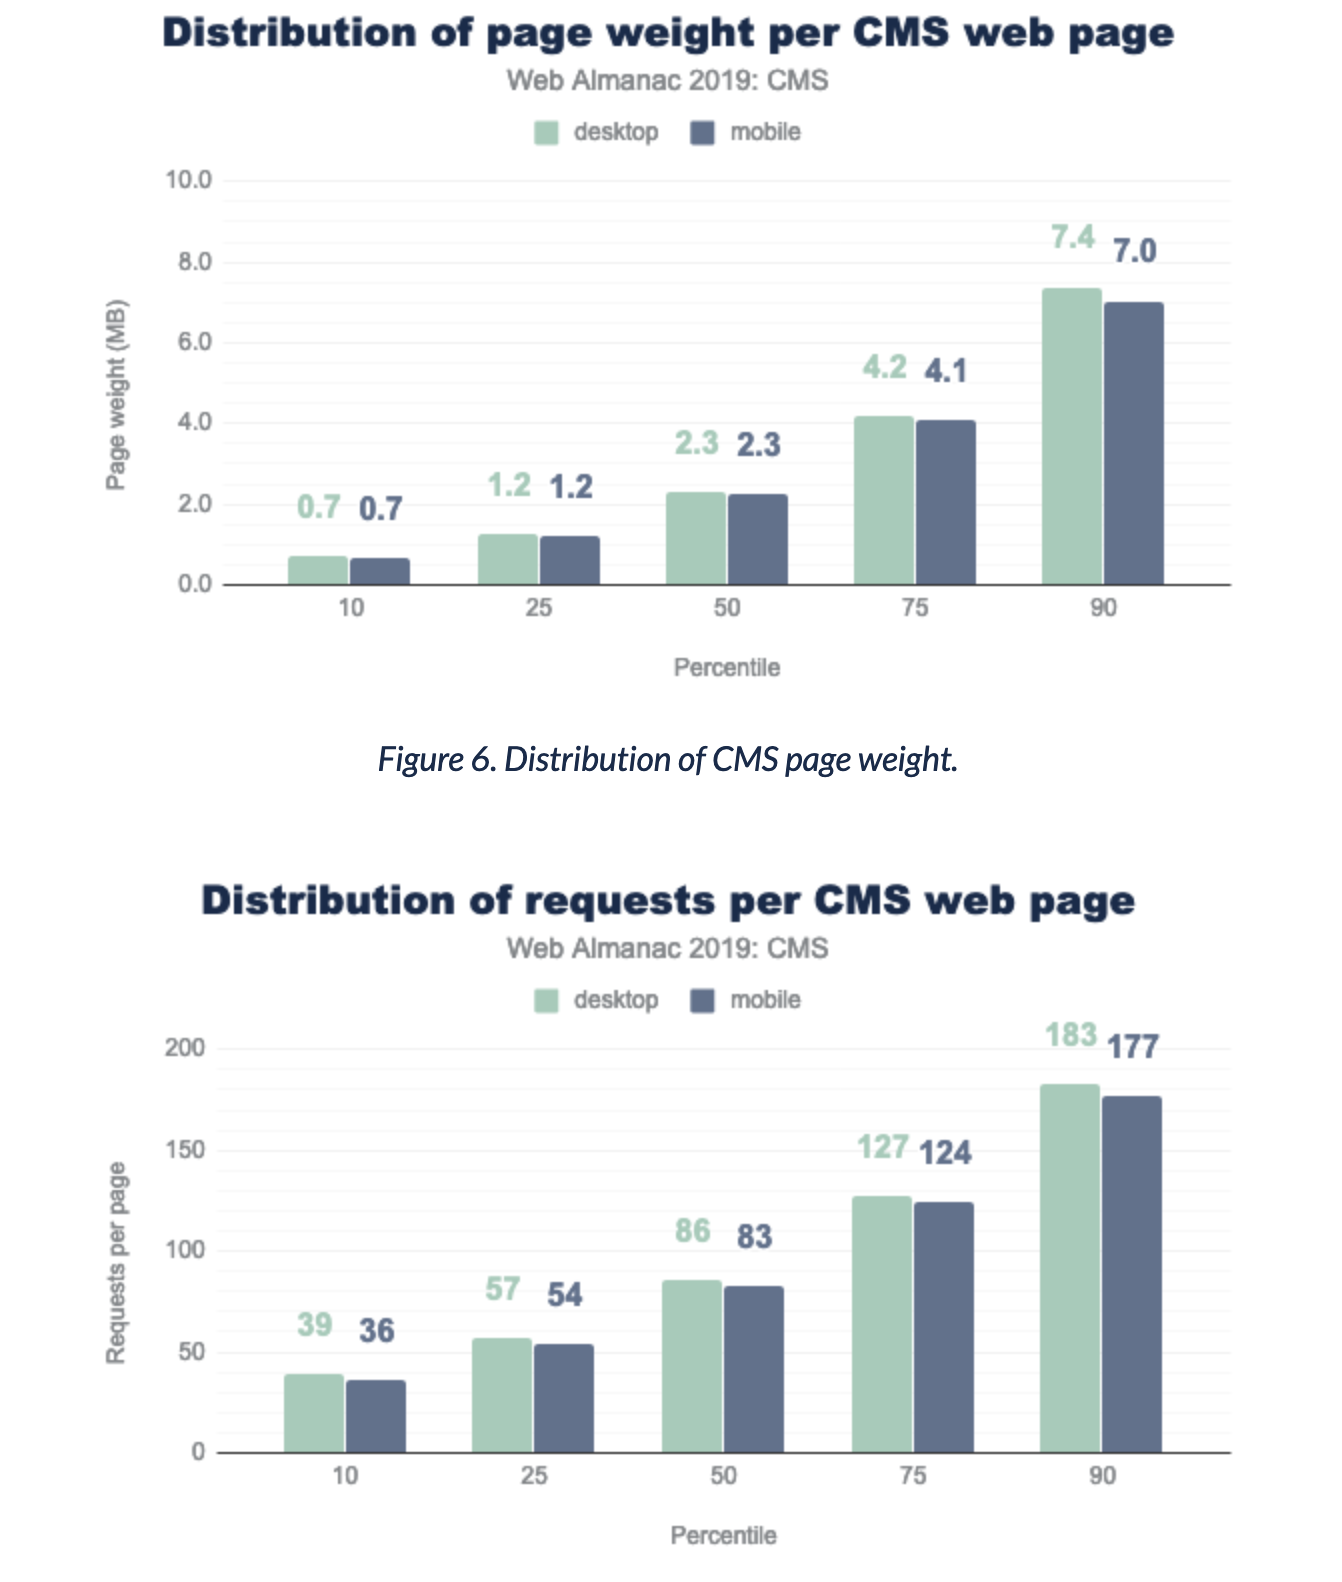
Page weight and number of requests of CMS sites
Section titled Page weight and number of requests of CMS sitesCMS pages are heavy and make many requests... I did Wordpress development in the past and that makes sense thinking of the audience and users of e.g. wordpress. "Just install another plugin"...
CDN adoption
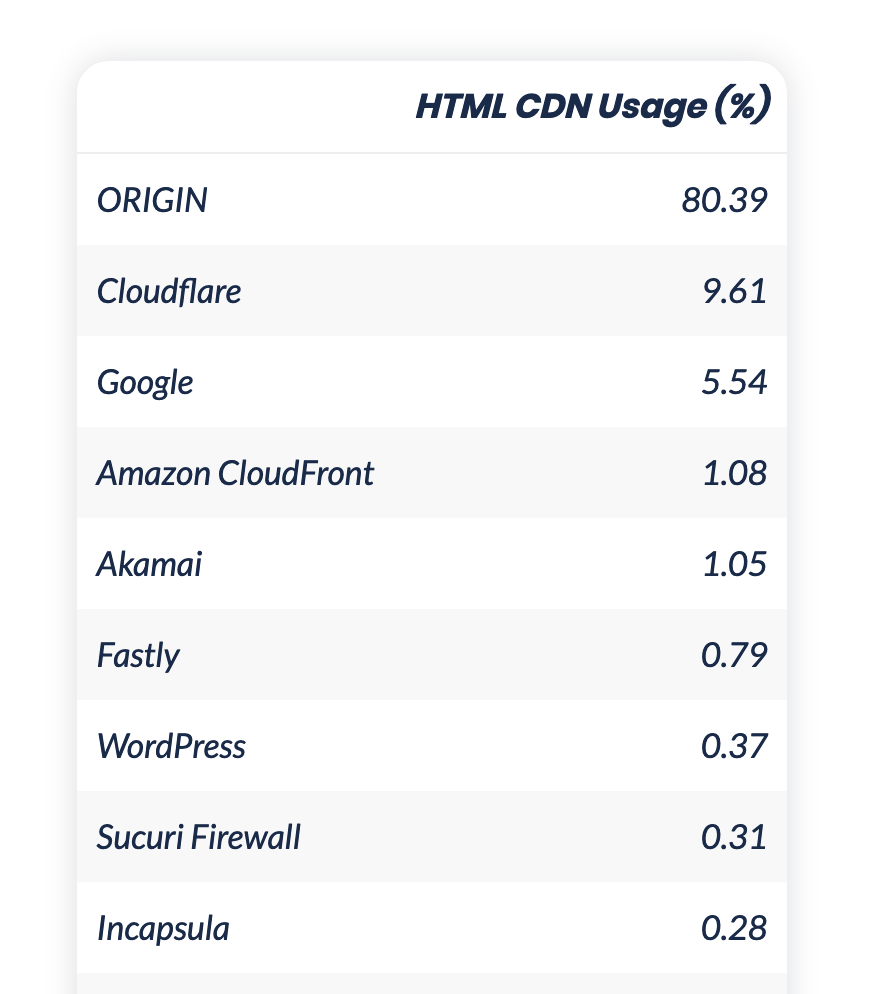
Section titled CDN adoptionHTML is mainly served from its origin server (80%). Most used CDN is cloudflare (10%). ?
Overall page weight
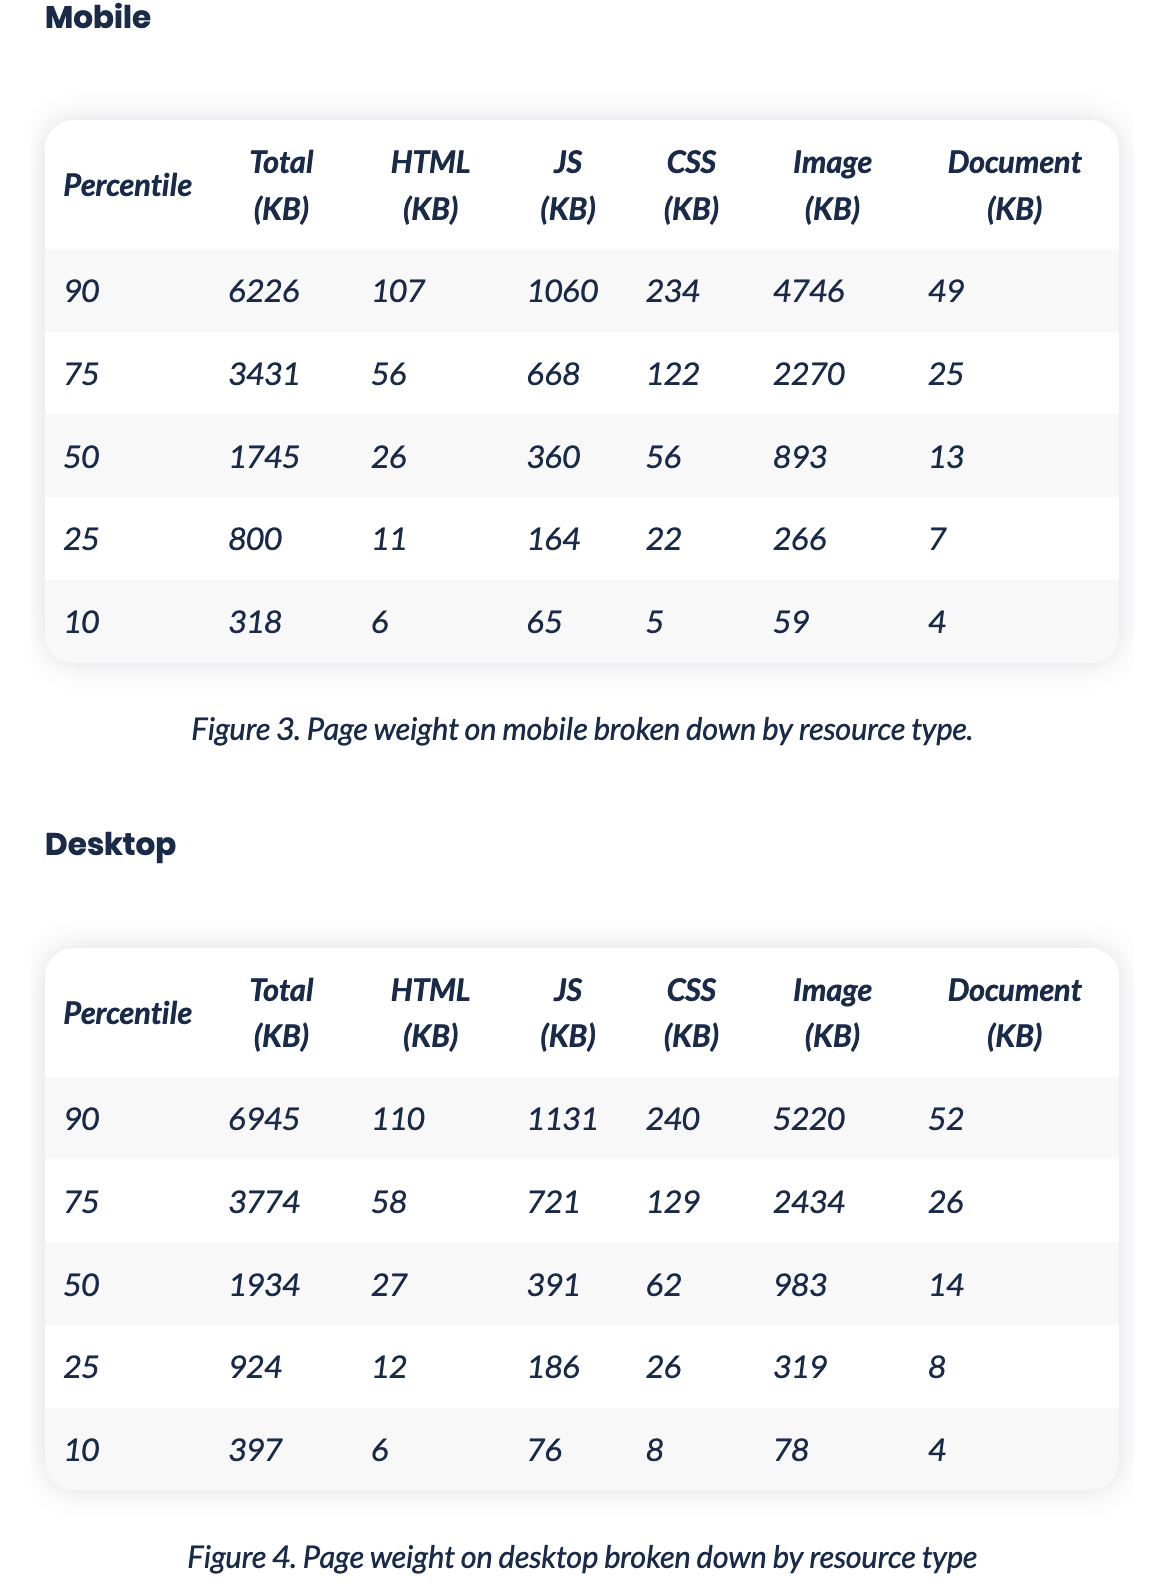
Section titled Overall page weightI thought the median value for page weight would be higher these days. :D On desktop it's 1.9MB and on mobile, it's 1.7MB. It's still fairly high though imo. ? (and median is clearly only one piece of the puzzle)
And that's it. I highly recommend to check it out! It's a very fascinating and interesting read about the state of the internet. :)
Reply to Stefan
This content originally appeared on Stefan Judis Web Development and was authored by Stefan Judis
Stefan Judis | Sciencx (2019-11-30T23:00:00+00:00) Highlights of the HTTP Archive Web Almanac (#blogPost). Retrieved from https://www.scien.cx/2019/11/30/highlights-of-the-http-archive-web-almanac-blogpost/
Please log in to upload a file.
There are no updates yet.
Click the Upload button above to add an update.

