This content originally appeared on JavaScript January and was authored by Emily Freeman
Many, many thanks to the amazing Jordan Hamel for this article!
Every user loves speed.
We all want faster, more reliable user experiences. JavaScript is at the heart of most web experiences and much tooling and books/blog posts have come out of the need to keep experiences fast and reliable for users. The awesome explosion of frameworks has also meant an explosion of JS and third-party JS on pages, which increased 700% from 2011-2018, the same time frame we went from 2G to LTE.
But it's not just JavaScript that effects performance so why bring it up here? By the end of the post I hope you'll see the power of unifying the story on performance for a shared audience when your goal is to improve the user experience. Overall perf improvements can rarely happen in a vacuum of highly dependent frameworks and platforms.
The open source tooling to track and benchmark the user experience has improved so much in the same time that I want to focus on a few of the newer timing metrics beyond the normal w3c timings we've had for years. You don't have to work on a performance team to have a performance driven plan for your application.
In general you can think of performance tracking as split into two halves of the same circle; there's the real user instrumentation or monitoring (RUM) which has been around in many forms for years as JS snippets or libaries like Boomerang.js et al to capture the timings available at the user browser/mobile app level and then there is the synthetic benchmark, which gives you consistant signal for tracking changes to your app overtime while holding the environment details steady.
Enter : https://sitespeed.io
Here's where Sitespeedio comes in, it's an open source benchmarking suite of tools that I stumbled upon years ago when I was running Newegg.com and it's become an invaluable tool to tell the story of a website's performance and content changes over time. Let's go through getting an environment setup to see how easy it is to get started. For the sake of this post I want to focus on a few of the newer timings metrics that matter with JavaScript: First Input Delay, Contentful Speed Index, Visual Change Time, ScriptDuration, JSHeapUsedSize among others. We'll also see how to use JS to drive Sitespeed.io through the user journey and capture new metrics along the way that will tell a unified performance story for every audience beyond JS developers alone.
Grafana & Graphite Environment Setup
Sitespeed.io has great getting started guides, and what you'll see here is abbreviated get straight to work with the benchmarks you'll see today. The docker format really works well here as the container lives the life of the test and packages many many dependencies and tools used to gather all kinds of amazing stuff like Chrome, Firefox, Browsertime and more. This compose file is from sitespeed.io to get Graphite and Grafana up and running. Note: neither of these are dependencies to use sitespeed.io as you will see, but can work together well for further trend analysis
~~~bash
curl -O https://raw.githubusercontent.com/sitespeedio/sitespeed.io/master/docker/docker-compose.yml
//get things running quickly, but take a peek at the yml to see what you will be running

docker-compose up -d
1st Test - Running the tests on JavaScriptJanuary.com - with crawler mode
~~~bash
docker run --rm -v "$(pwd)":/sitespeed.io sitespeedio/sitespeed.io:11.9.3 -n 3 --crawler.exclude "/blog/tag/" --crawler.exclude "/blog/category/" --graphite.host localhost https://javascriptjanuary.com -d 2
Let's break it down, so it's going to test each page 3 times, exclude url's with paths containing /blog/tag and /blog/category, send the metrics for storage to the running graphite container, using https://javascriptjanuary.com with a depth of 2, meaning it will follow every link on the page 1 level down, hence "Crawler" mode. Other defaults will create the local reports, filmstrip, and video as well.
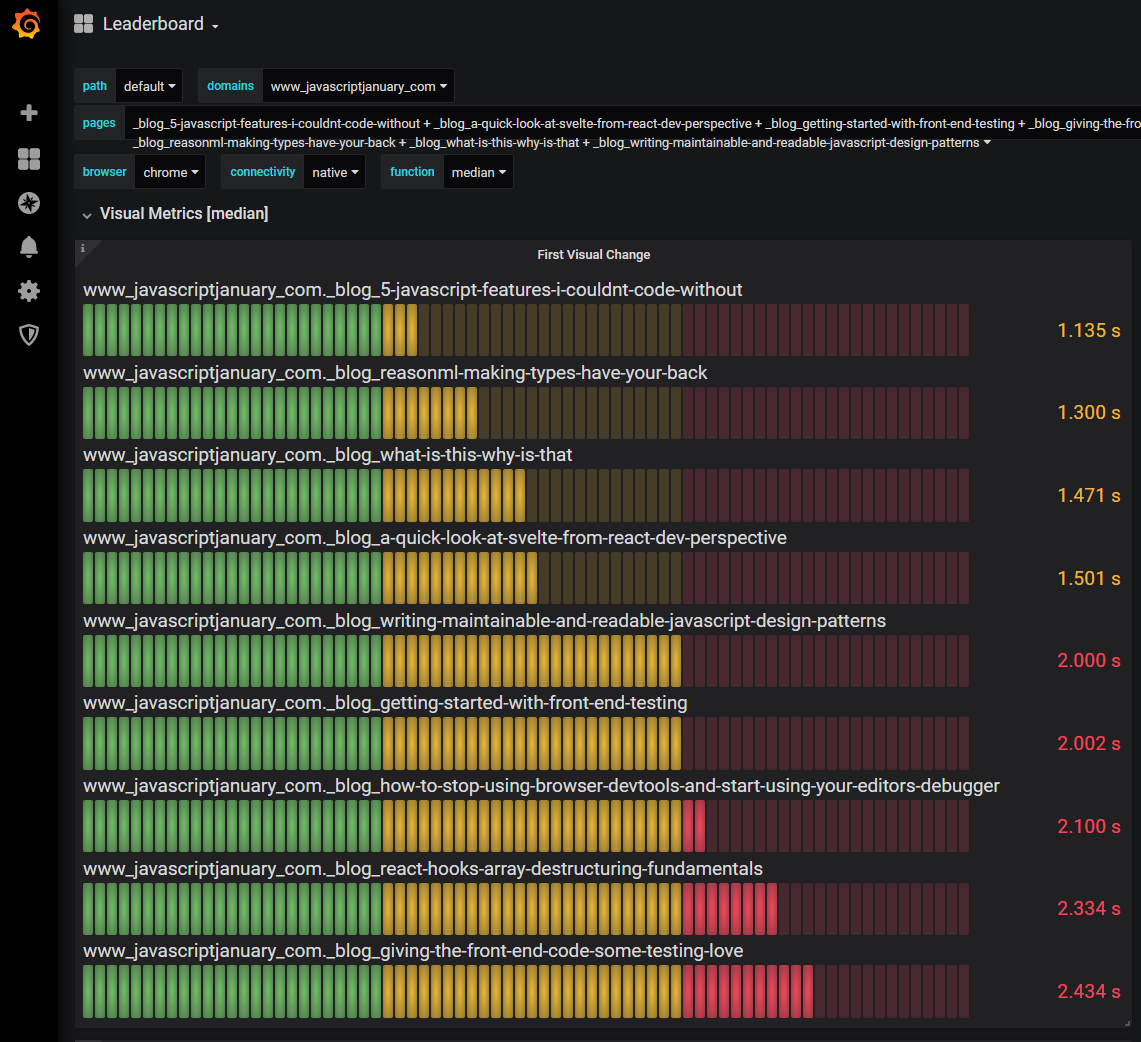
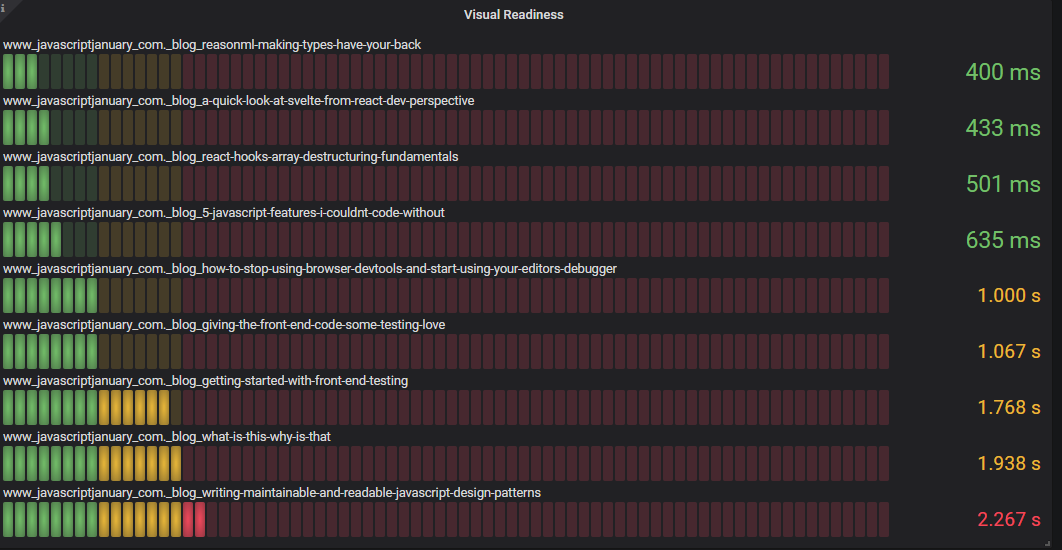
- It gives us data like this: Leaderboard Dashboard in Grafana for tracking combined performance per page, here First Visual Change and Visual Readines is featured, as it's something all users want: see the page they came for! 2020 Internet is known for blocking the blocker(ads/popup/splashcreens)
- And this: CPU Long Task which means "The average number of CPU Long Tasks per page. A CPU long Task is by default a CPU task that takes longer than 50 ms to run. This metrics is Chrome only at the moment."

- JavaScript Transfer Size helpful for catching growth in JS and un-intentional uncompressed scripts. This is the bandwidth used up metric by JS on the page.
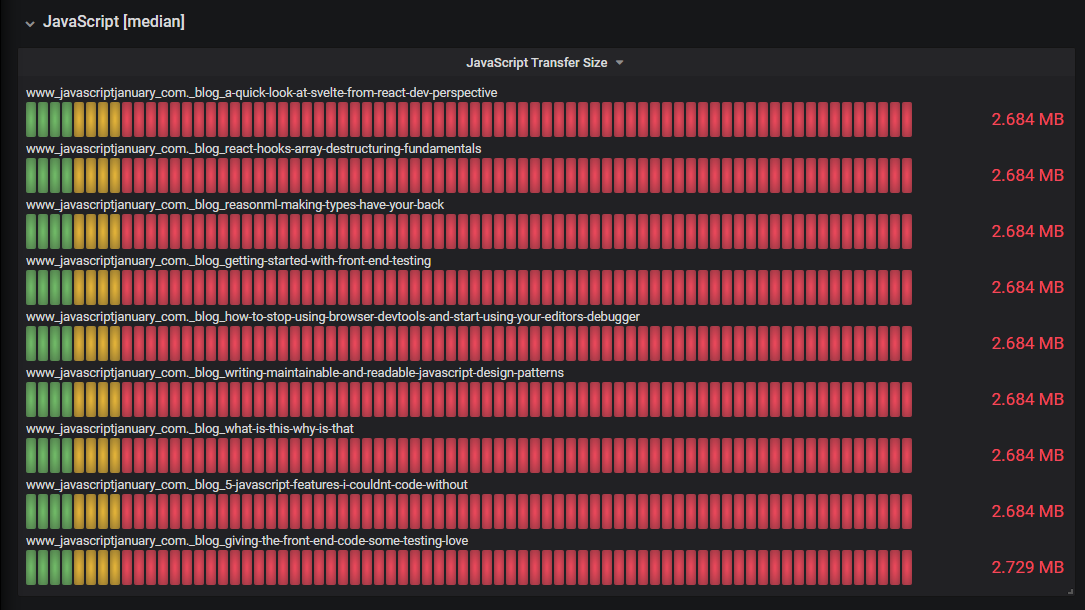
One benefit of having many of your key pages tracked together is that you can script the test to follow your user journey. If your homepage is great but step 2 is not, you want to optimize step 2 and keep it consistant so the pages load consistenty. Inconsistancy is percieved worse often when users get used to that fast optimized first page.
- Chrome Per Event CPU Metrics - JS render and script evaluation if you're optimizing layout, script elements etc. it can be impossible to determine what improves a single page speed score, better to have each event metric tracked

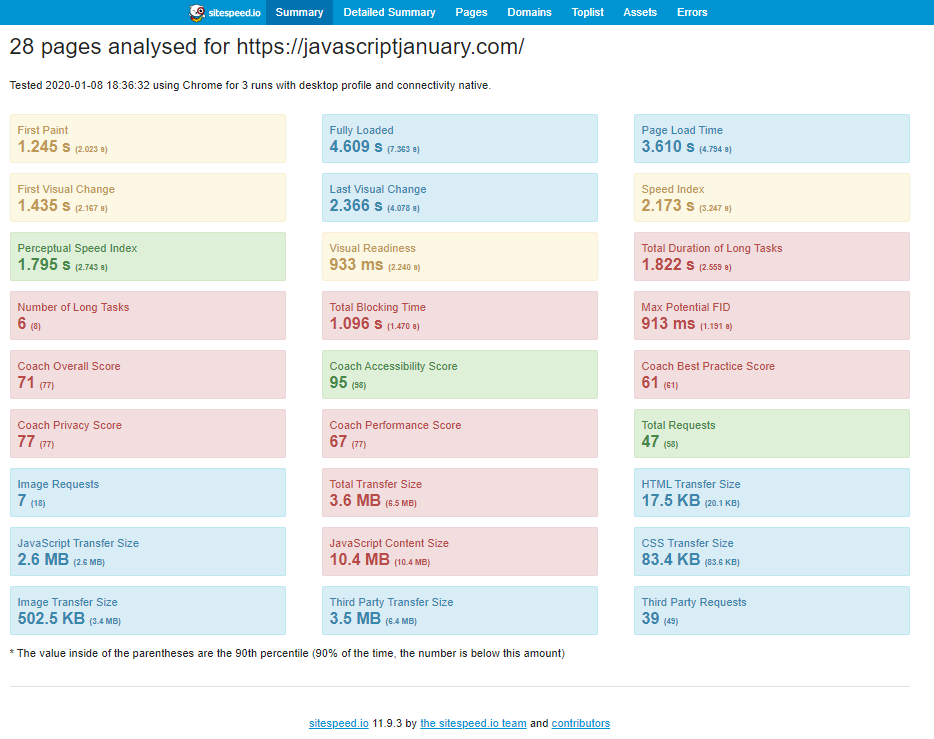
- You also get this local Sitespeedio Report by default which helps you navigate the gold mine of metrics:
2nd Test - Sitespeed scripted test navigate and click - measuring First Input Delay
docker run --rm -v "$(pwd)":/sitespeed.io sitespeedio/sitespeed.io:11.9.3 test.js --multi --cpuHere you can see instead of naming the site, I just list the test.js that contains my script telling Sitespeed.io the multi step journey I want to measure. --cpu gets additional cpu metrics you saw above. For any js script you need the --multi flag. This context is Browsertime context or Selenium Webdriver (both available) and Commands wraps JS to make it easier to do things like commands.navigate() to start opening a page for example. This will open which ever browser you choose, default is Chrome
   //test.js
    module.exports = async function(context, commands) {
        // We have some Selenium context
        const webdriver = context.selenium.webdriver;
        const driver = context.selenium.driver;

        // Start to measure
        await commands.measure.start();
        // Go to a page ...
        await commands.navigate('https://javascriptjanuary.com');

        // When the page has finished loading find the next step identified by the class name, in this case the first article
        const actions = driver.actions();
        const nav = driver.findElement(
          webdriver.By.className('Blog-header-content-link')
        );
        //click on the link identified in the className above
        await actions.click(nav).perform();

        // Measure everything, that means you will run the JavaScript that collects the first input delay
        return commands.measure.stop();
      };
- First Input Delay - "First Input Delay (FID) measures the time from when a user first interacts with your site (i.e. when they click a link, tap on a button, or use a custom, JavaScript-powered control) to the time when the browser is actually able to respond to that interaction." - developers.google.com

This is a separately calculated metric, not directly available as a w3c navigation timing. Sitespeedio calculates this for you when you setup the commands.measure.start() and return commands.measure.stop() over the course of a 2 step or N-step script. It's really helpful to know if there are aspects of your page that freeze on mousedown operations. When you're building for what I call the "50-tab users", keeping jsheapsize down can help! We all know someone who has 50 or more tabs open right now, users don't always access our creations in a clean environment, and it's good to plan for the worst peformance scenarios
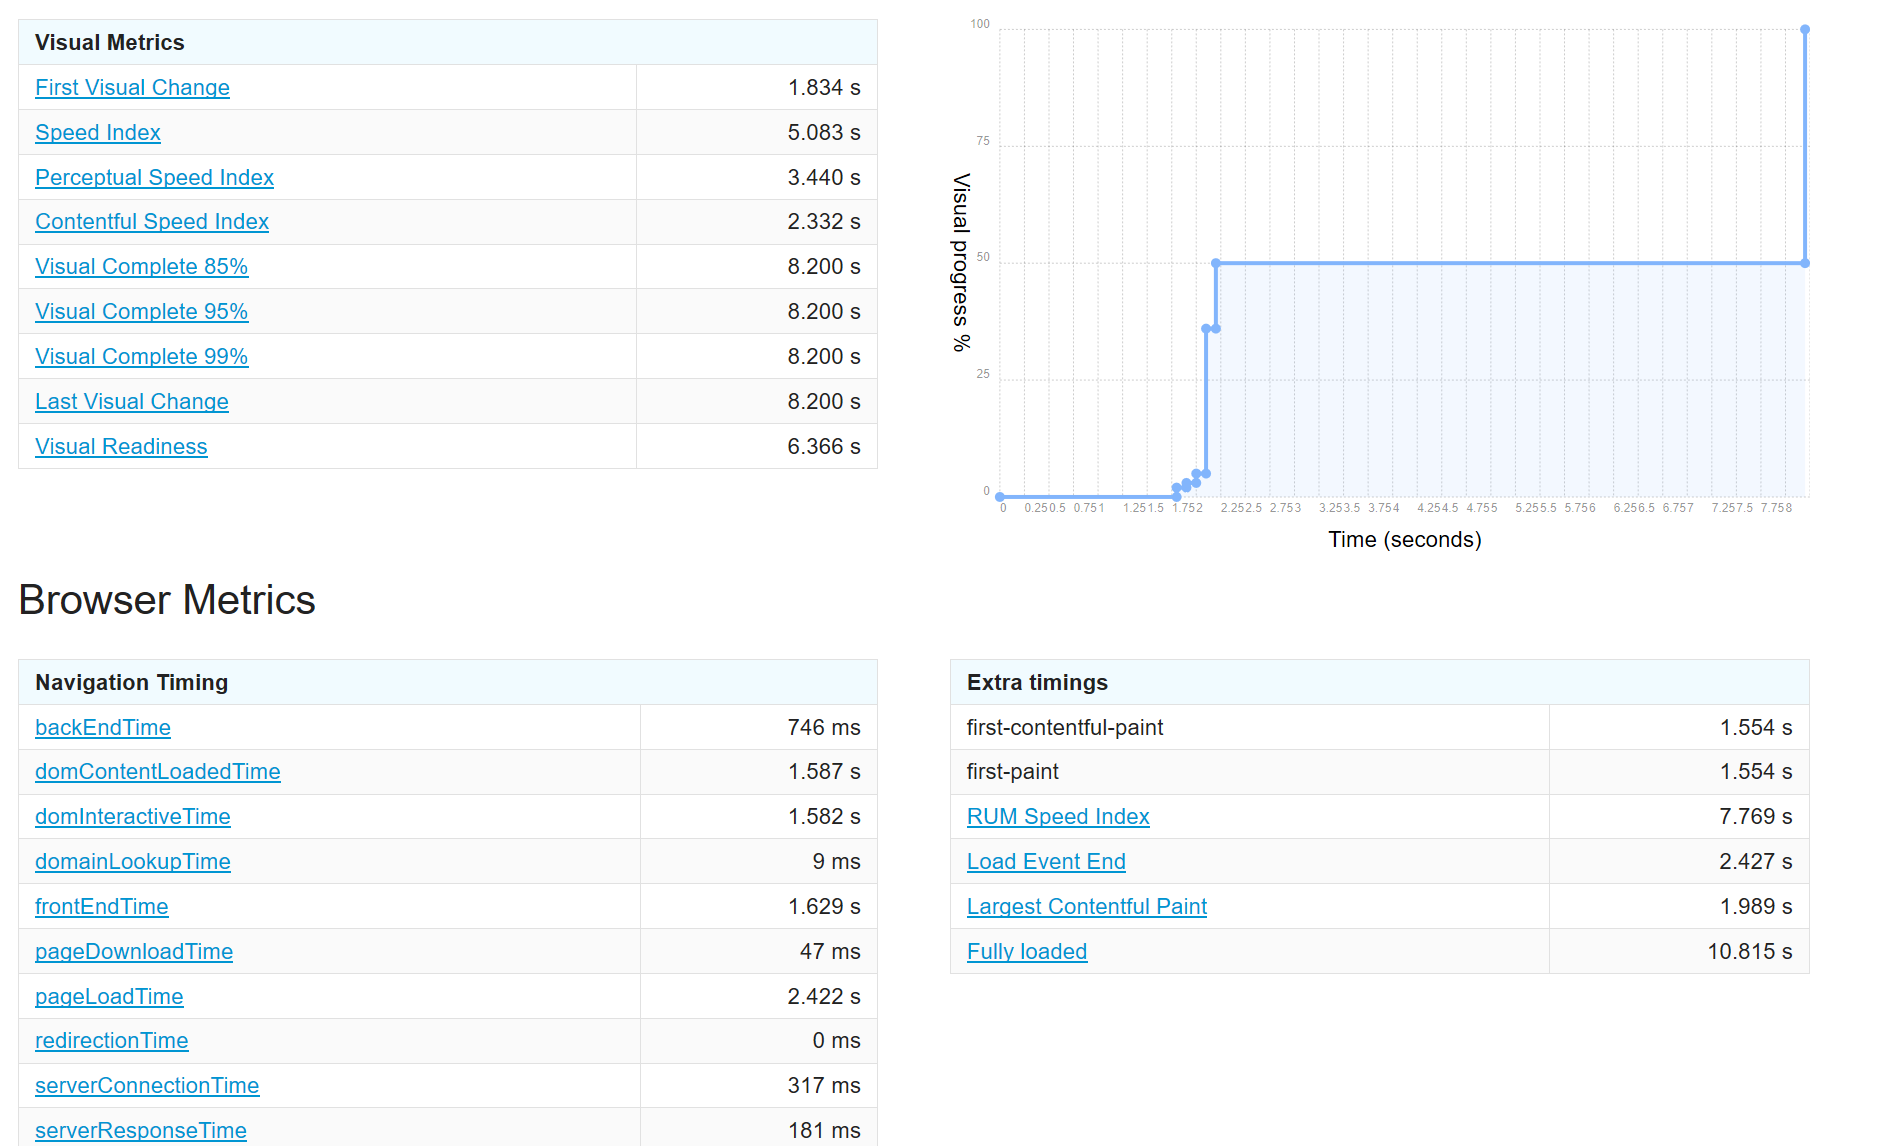
- Largest Contentful Paint (LCP) This gives developers a way to measure when the main content of the site is displayed. In this case we can see the header image, the largest on the blog post we navigated to that has to do the most rendering takes up the most time.

Third and Final Test: Add pure JS to capture a new metric from the page
One of the more useful ways to use JavaScript directly with Sitespeed.io is commands.js.run() which let's you execute JavaScript directly in the Browsertime context on the page. There are many scenario's but this should give you an idea of it's power and the second feature to note is commands.measure.add() which let's you write in your own custom scripting metric which will be saved to the html report and to graphite in this case. Note: directly run js metrics are put under Extra metrics section, the Custom Metrics section refers to capturing metrics with a post-test separate JS. 0 Comments at the time the test was run :-)
   //jsjanuary.js
    module.exports = async function(context, commands) {
       await commands.measure.start('javascript-january'); //alias is now changed to text
       await commands.navigate('https://www.javascriptjanuary.com/blog/choosing-a-style-library-for-your-react-project');

       //use commands.js.run to return the element using pure javascript
       const element = await commands.js.run('return(document.getElementsByClassName("comment-count")[0].innerText)');

       //parse out just the number of comments
       var elementMetric = element.match(/\d/)[0];

       // need to stop the measurement before you can add it as a metric
       await commands.measure.stop();

       // metric will now be added to the html and outpout to graphite/influx if you're using it
       await commands.measure.add('commentsCount', elementMetric);

    };
- Custom Metrics let's you add in your own metrics as long as you can get it with JS execution. You can see in my case it was a "business metric" like comments on a post which yes there are many ways to track this for real users, but for the benchmark use case it should give you ideas of what you could do like verify your A/B test changed an item or something along those lines. Many use cases!

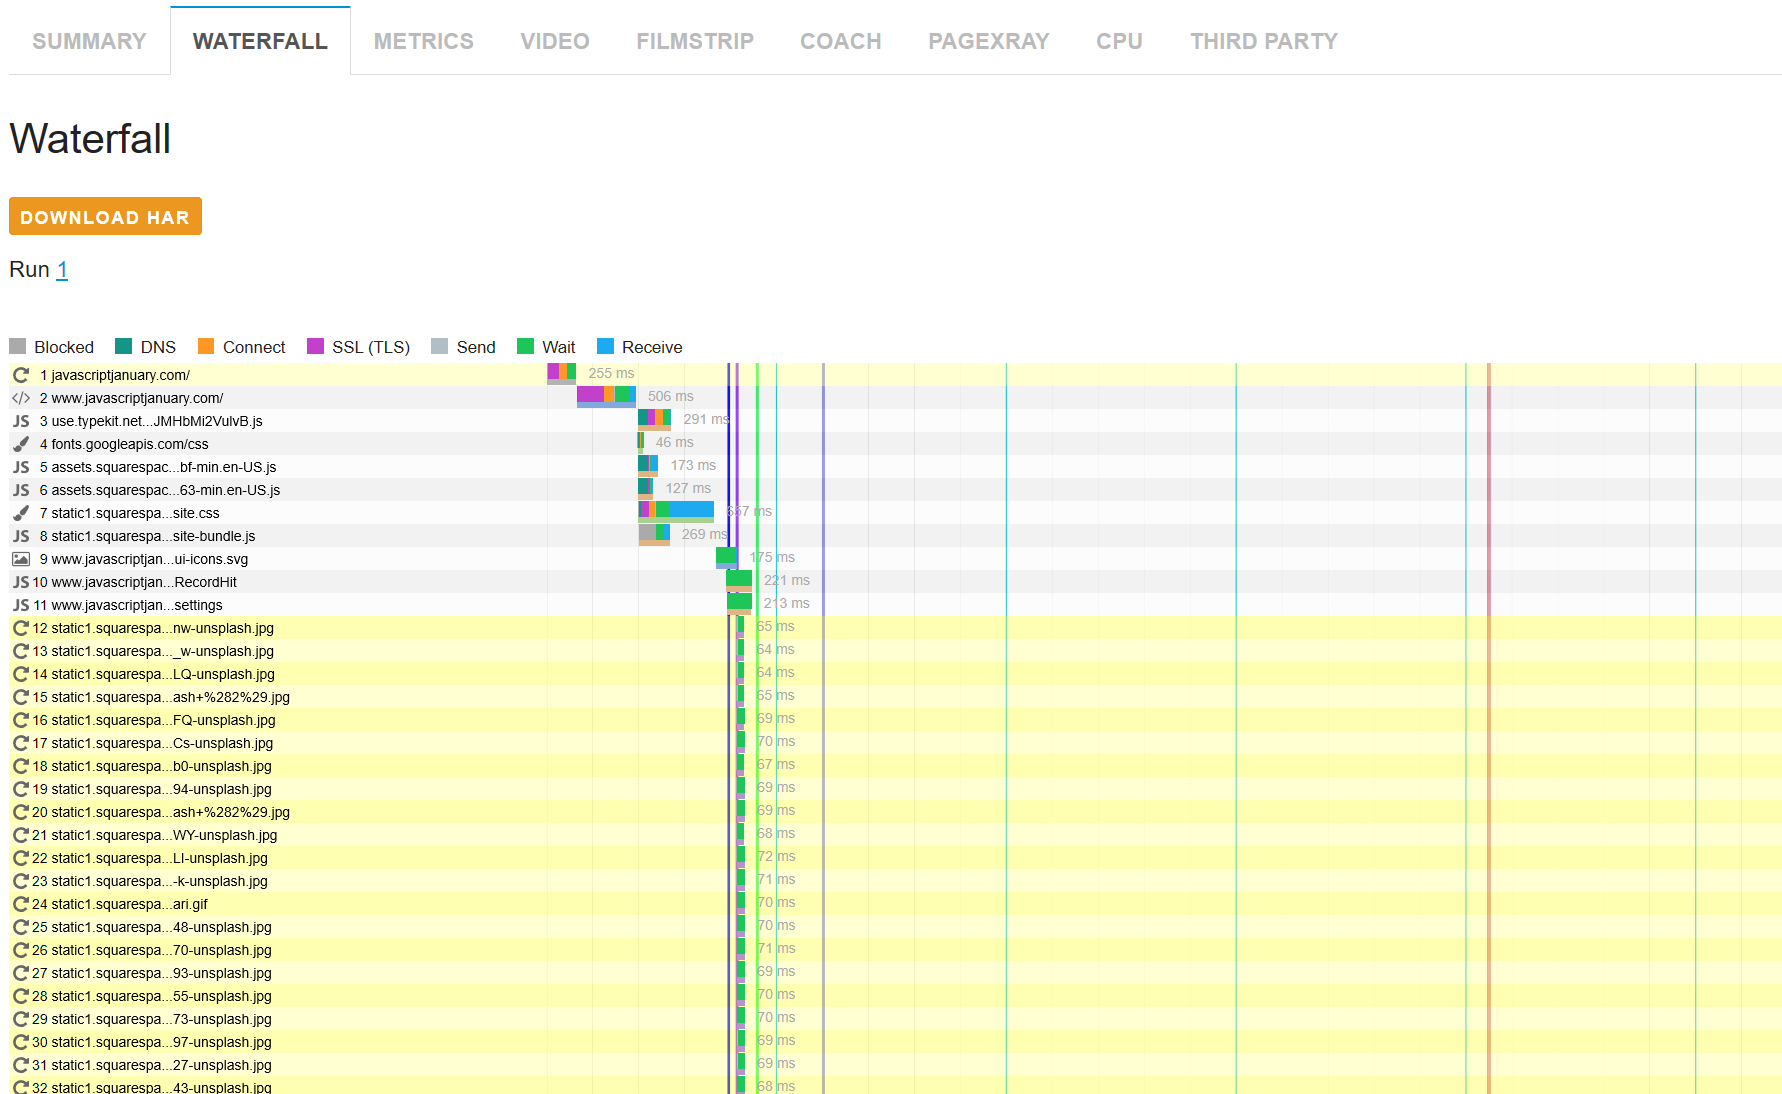
- Waterfall the waterfall with all timings and http headers are here as well! Incredible detail for finding out intermittent issues in your stack
Wrap Up
Metrics have feelings too - video capture of the the page as loaded during the test run.
It records an mp4, this is just a gif of one recording. The timing events overlay in sync as they occur.

How do your users feel about it? As org complexity affects web dev complexity (marketing, testing, dev,ops,sre,ux) You have to find ways to agree on the feel of something along side the metrics. Good news! Sitespeedio also puts feelings behind your metrics. When you gather everyone around a shared experience like a benchmark of a point in time recorded version of your app/content/ads/twitter button etc, it gets people talking and unifies further decision making. This can be turned on/off per test run but can be invaluable to seeing what's really happening in specific browsers and versions of code.
Hopefully this has been a helpful intro into to new metrics and tools that will help you become a performance minded js developer and user! The tools here integrate with so much more and there's plenty of discovery left for you to do.
Special Thanks to Sitespeed.io creator Peter Hedenskog and to Emily Freeman for running JavaScript January
Other Helpful Links
This content originally appeared on JavaScript January and was authored by Emily Freeman
Emily Freeman | Sciencx (2020-01-22T14:01:00+00:00) Tracking JavaScript Performance with JavaScript & Sitespeedio. Retrieved from https://www.scien.cx/2020/01/22/tracking-javascript-performance-with-javascript-sitespeedio/
Please log in to upload a file.
There are no updates yet.
Click the Upload button above to add an update.
