This content originally appeared on DEV Community and was authored by Kevin Gilpin
Rails + Your Code = ❤️. Most of the time!
The one criticism that sticks to the Rails framework (and any other big framework, to be honest), is that Rails does so much for you it can be hard to understand what's really going on. Usually, we can just follow the Rails cookbooks and watch the magic happen. But sometimes, we really need to understand how Rails (and projects in the Rails ecosystem like Rack, Devise, Sequel, Delayed Job | Resque | Sidekiq, database drivers, etc) actually work. And even more importantly, how they work with your code.
You're probably already familiar with REPL and debugging tools like pry and byebug. These tools take an "inside-out" approach to troubleshooting. You choose a point in your code where you want to start, and then you can explore outwards from there. But while you can get a lot of detailed information that way, it's hard to build an understanding of what's going on overall in the codebase.
So what happens when you don't even know where to start? Then you need more of an "outside-in" approach. Here's a cookbook you can follow to see how your code is working with Rails and other gems, starting from the widest scope and narrowing in on details.
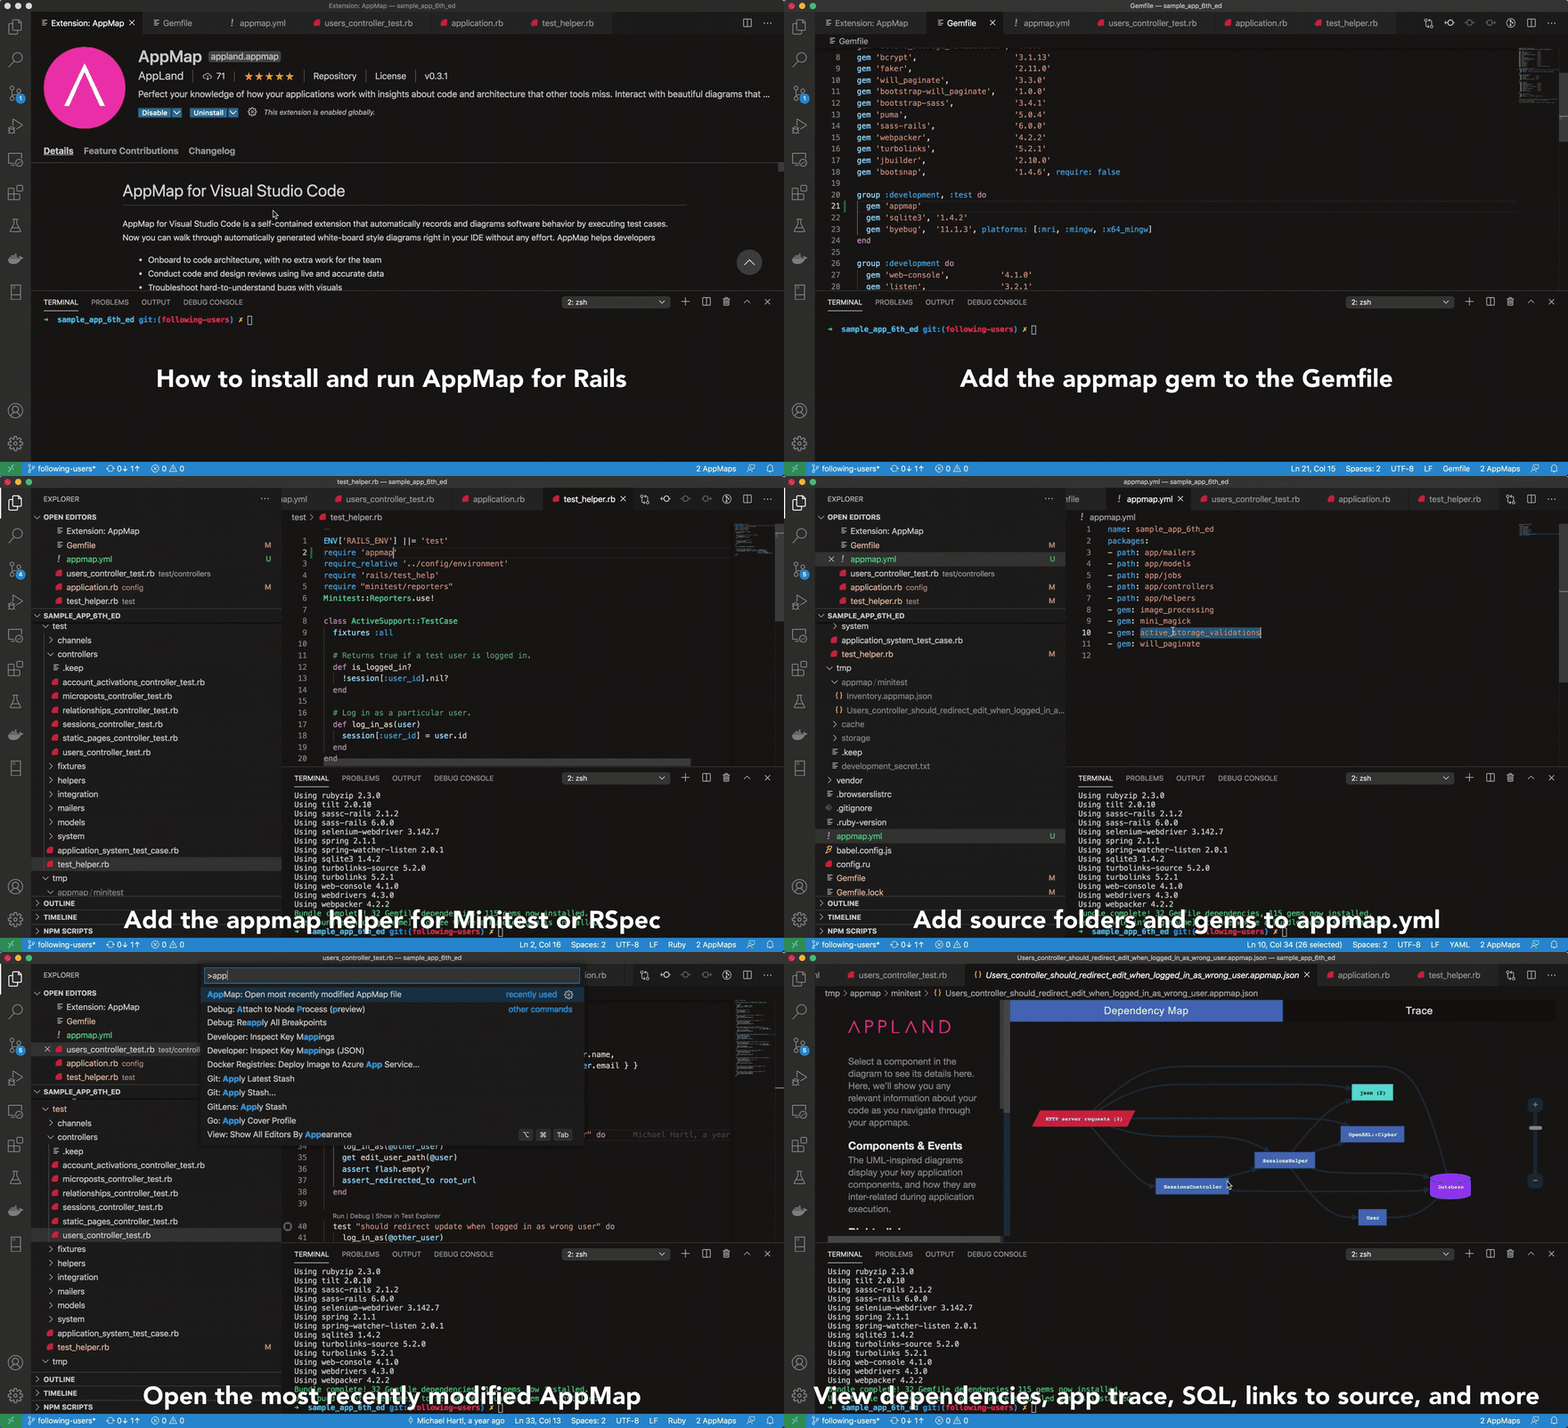
We will be using a an open source tool called AppMap for VSCode (disclaimer: I'm an AppMap developer). AppMap automatically builds diagrams of software architecture and runtime behavior. Here's how you do it.
1. Install and configure the appmap gem
Install the appmap gem by following the instructions in the README. Here's a quick checklist:
- Add the
appmapgem to the Gemfile. - Add the Railtie.
- Configure
config.appmap.enabledinapplication.rb. - Update the
spec_helperortest_helper, if applicable. - Create
appmap.ymland configure thenameandpackages.
2. Add dependency gems to appmap.yml
Quit your VSCode session and use this Gist to open a VSCode project with all the Rails source code. You are doing this so that you will be able to click into dependency gem source code from the diagrams.
When you run the rails_gem_paths.rb script, it will print out a list of action* and active* gem names.
Copy and paste these lines into your appmap.yml file, so that it looks like this:
name: my_project
packages:
- path: app/models
- path: app/controllers
  ... any other project source folder
- gem: rack
- gem: paperclip
- gem: actionview
- gem: activerecord
  ... any other dependency gem you want
You can also add other gems, such as paperclip, aws-sdk, imagemagick, etc. Whatever you need.
Here's an example appmap.yml that I use with the my fork of the Rails Sample App 6th Edition.
3. Record the code trace
Now you have a choice of how to record your code.
Option 1: Run tests
If you have an RSpec or Minitest test that performs the behavior that you want to observe, run this test with APPMAP=true.
Option 2: Run the server and use the app
If you don't have a test that does what you need, run the server with WEB_CONCURRENCY=1 and APPMAP_RECORD=true.
Then open your app in the browser and interact with it. If your app is an API server, run the server and send API requests. Either way, you'll get an appmap.json file when the server exits.
4. View the diagrams
AppMap for VSCode enables you to open any *.appmap.json and explore it visually. If you ran test cases, you can find the diagrams in tmp/appmap/[minitest | rspec]. If you generated an appmap.json, rename it something representative, like login.appmap.json. Then click on it in VSCode to view it.
An example
Here are some diagram examples, for which I'm using the Rails Sample App 6th Edition. I mapped a test case in which a user signs up for the sample app using valid information.
When I open the AppMap, the first thing that I see is the Dependency map, which shows the HTTP server requests, code packages (both app code and the gems we included in appmap.yml), as well as the database. Lines on the graph correspond to function calls (not just statically inferred dependencies; actual runtime calls). You can see how the controller makes calls to activemodel, app/helpers, and activerecord. On the left hand side, you can see the controller methods which are used in this test case (new, create, show), as well as the inbound and outbound functions.
You can navigate from any code component to the source code, and you can step from the dependency map view over to the detailed Trace view. The Trace view shows details of code execution, including parameter values, return values, and SQL.
How about if I want to explore the app from a SQL perspective? This video clip shows how to find a SQL query of interest and then step back up through the Rails framework that generates the query, all the way back into user code (UsersController#create).
Wrap-up
I hope you find this helpful! You can find more resources about using AppMap for VS Code on the extension page, and on the AppLand blog.
This content originally appeared on DEV Community and was authored by Kevin Gilpin
Kevin Gilpin | Sciencx (2021-02-12T16:50:46+00:00) How to debug interactions between your code and the Rails framework (and other gems). Retrieved from https://www.scien.cx/2021/02/12/how-to-debug-interactions-between-your-code-and-the-rails-framework-and-other-gems/
Please log in to upload a file.
There are no updates yet.
Click the Upload button above to add an update.

