Visualize Linear Regression with Matplotlib, Pandas, and Sklearn

in just 9 lines of code!

Photo by Chris Liverani on Unsplash

What you will learn:

  • How to make a simple linear regression model.

What you need:

  • A basic understanding of Python

Recommended:

  • Experience with Pandas
  • An IDE of your choice

Packages

We need matplotlib.pyplot, pandas, and sklearn.linear_model for this tutorial.

pip install matplotlib
pip install pandas
pip install scikit-learn

Import them into your Python file:

import matplotlib.pyplot as plt  
import pandas as pd  
from sklearn.linear_model import LinearRegression

Retrieving the dataset

You can download the dataset from here or make a file called data.csv, and copy the lines below into it.

32.502345269453031, 31.70700584656992
53.426804033275019, 68.77759598163891
61.530358025636438, 62.562382297945803
47.475639634786098, 71.546632233567777
59.813207869512318, 87.230925133687393
55.142188413943821, 78.211518270799232
52.211796692214001, 79.64197304980874
39.299566694317065, 59.171489321869508
48.10504169176825,  75.331242297063056
52.550014442733818, 71.300879886850353
45.419730144973755, 55.165677145959123
54.351634881228918, 82.478846757497919
44.164049496773352, 62.008923245725825
58.16847071685779,  75.392870425994957
56.727208057096611, 8.43619215887864
48.955888566093719, 60.723602440673965
44.687196231480904, 82.892503731453715
60.297326851333466, 97.379896862166078
45.618643772955828, 48.847153317355072
38.816817537445637, 56.877213186268506
66.189816606752601, 83.878564664602763
65.41605174513407,  118.59121730252249
47.48120860786787,  57.251819462268969
41.57564261748702,  51.391744079832307
51.84518690563943,  75.380651665312357
59.370822011089523, 74.765564032151374
57.31000343834809,   95.455052922574737
63.615561251453308, 95.229366017555307
46.737619407976972, 79.052406169565586
50.556760148547767, 83.432071421323712
52.223996085553047, 63.358790317497878
35.567830047746632, 41.412885303700563
42.436476944055642, 76.617341280074044

Result:

https://medium.com/media/0e7b695bea2907bec86161a0bbc3ec58/href

Reading the dataset

Let’s load the data set with

data = pd.read_csv('data.csv')

and reshape it using

x = data.iloc[:, 0].values.reshape(-1, 1) 
y = data.iloc[:, 1].values.reshape(-1, 1)

This will turn the data into a format like this, which the program can learn from:

[[53.42680403]
[61.53035803]
[47.47563963]
[59.81320787]
[55.14218841]
[52.21179669]
[39.29956669]
[48.10504169]
[52.55001444]
[45.41973014]
[54.35163488]
[44.1640495 ]
[58.16847072]
[56.72720806]
[48.95588857]
[44.68719623]
[60.29732685]
[45.61864377]
[38.81681754]
[66.18981661]
[65.41605175]
[47.48120861]
[41.57564262]
[51.84518691]
[59.37082201]
[57.31000344]
[63.61556125]
[46.73761941]
[50.55676015]
[52.22399609]
[35.56783005]
[42.43647694]]

Fitting the model

We’ll define another variable to fit the model and pass in x and y as parameters:

linear_regressor = LinearRegression().fit(x, y)

Now, we can predict the result with .predict(), we’ll pass in x as a parameter.

y_pred = linear_regressor.predict(x)

Drawing the graph

We’ll plot all of the points with plt.scatter,

plt.scatter(x, y)

and draw a line with x and our predicted value, y_pred.

plt.plot(x, y_pred, color='green')

Let’s show the graph.

plt.show()
Figure 1: Finished graph

The regression was successful!

Finished code:

https://medium.com/media/ecbc6b04fdfc403e0ca67ac7c159a678/href

Resources

Code inspired from Adarsh Menon.

Sckit-Learn’s Linear Regression Documentation.

Conclusion

Thanks!

I hope you enjoyed reading this, and that it taught you more about Linear Regression. If you have any questions, suggestions, general feedback, or your code doesn’t work, put in the comments!

Keep on coding!


Visualize Linear Regression with Matplotlib, Pandas, and Sklearn was originally published in Level Up Coding on Medium, where people are continuing the conversation by highlighting and responding to this story.


This content originally appeared on Level Up Coding - Medium and was authored by Ryan Chou

in just 9 lines of code!

Photo by Chris Liverani on Unsplash

What you will learn:

  • How to make a simple linear regression model.

What you need:

  • A basic understanding of Python

Recommended:

  • Experience with Pandas
  • An IDE of your choice

Packages

We need matplotlib.pyplot, pandas, and sklearn.linear_model for this tutorial.

pip install matplotlib
pip install pandas
pip install scikit-learn

Import them into your Python file:

import matplotlib.pyplot as plt  
import pandas as pd  
from sklearn.linear_model import LinearRegression

Retrieving the dataset

You can download the dataset from here or make a file called data.csv, and copy the lines below into it.

32.502345269453031, 31.70700584656992
53.426804033275019, 68.77759598163891
61.530358025636438, 62.562382297945803
47.475639634786098, 71.546632233567777
59.813207869512318, 87.230925133687393
55.142188413943821, 78.211518270799232
52.211796692214001, 79.64197304980874
39.299566694317065, 59.171489321869508
48.10504169176825,  75.331242297063056
52.550014442733818, 71.300879886850353
45.419730144973755, 55.165677145959123
54.351634881228918, 82.478846757497919
44.164049496773352, 62.008923245725825
58.16847071685779,  75.392870425994957
56.727208057096611, 8.43619215887864
48.955888566093719, 60.723602440673965
44.687196231480904, 82.892503731453715
60.297326851333466, 97.379896862166078
45.618643772955828, 48.847153317355072
38.816817537445637, 56.877213186268506
66.189816606752601, 83.878564664602763
65.41605174513407,  118.59121730252249
47.48120860786787,  57.251819462268969
41.57564261748702,  51.391744079832307
51.84518690563943,  75.380651665312357
59.370822011089523, 74.765564032151374
57.31000343834809,   95.455052922574737
63.615561251453308, 95.229366017555307
46.737619407976972, 79.052406169565586
50.556760148547767, 83.432071421323712
52.223996085553047, 63.358790317497878
35.567830047746632, 41.412885303700563
42.436476944055642, 76.617341280074044

Result:

Reading the dataset

Let’s load the data set with

data = pd.read_csv('data.csv')

and reshape it using

x = data.iloc[:, 0].values.reshape(-1, 1) 
y = data.iloc[:, 1].values.reshape(-1, 1)

This will turn the data into a format like this, which the program can learn from:

[[53.42680403]
[61.53035803]
[47.47563963]
[59.81320787]
[55.14218841]
[52.21179669]
[39.29956669]
[48.10504169]
[52.55001444]
[45.41973014]
[54.35163488]
[44.1640495 ]
[58.16847072]
[56.72720806]
[48.95588857]
[44.68719623]
[60.29732685]
[45.61864377]
[38.81681754]
[66.18981661]
[65.41605175]
[47.48120861]
[41.57564262]
[51.84518691]
[59.37082201]
[57.31000344]
[63.61556125]
[46.73761941]
[50.55676015]
[52.22399609]
[35.56783005]
[42.43647694]]

Fitting the model

We’ll define another variable to fit the model and pass in x and y as parameters:

linear_regressor = LinearRegression().fit(x, y)

Now, we can predict the result with .predict(), we’ll pass in x as a parameter.

y_pred = linear_regressor.predict(x)

Drawing the graph

We’ll plot all of the points with plt.scatter,

plt.scatter(x, y)

and draw a line with x and our predicted value, y_pred.

plt.plot(x, y_pred, color='green')

Let’s show the graph.

plt.show()
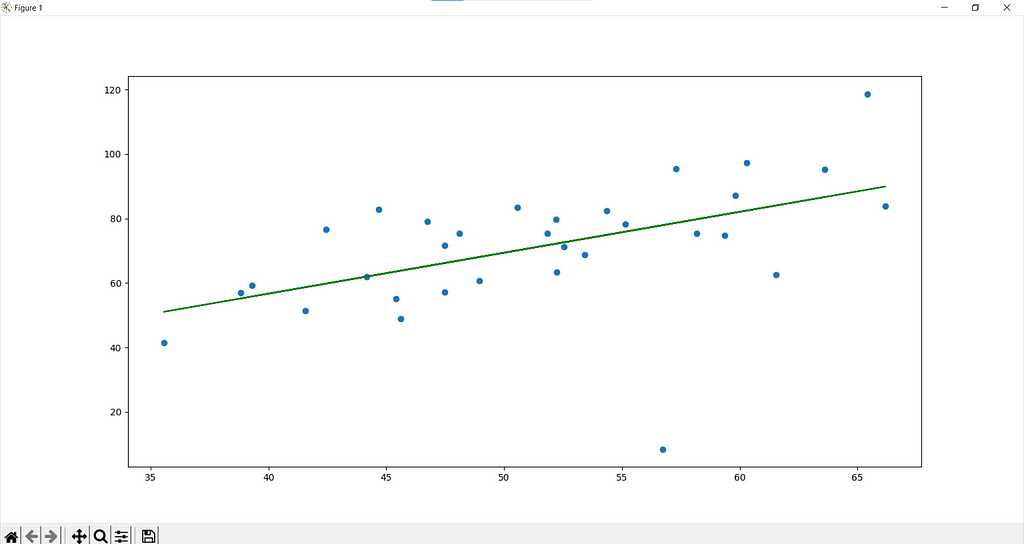
Figure 1: Finished graph

The regression was successful!

Finished code:

Resources

Code inspired from Adarsh Menon.

Sckit-Learn’s Linear Regression Documentation.

Conclusion

Thanks!

I hope you enjoyed reading this, and that it taught you more about Linear Regression. If you have any questions, suggestions, general feedback, or your code doesn’t work, put in the comments!

Keep on coding!


Visualize Linear Regression with Matplotlib, Pandas, and Sklearn was originally published in Level Up Coding on Medium, where people are continuing the conversation by highlighting and responding to this story.


This content originally appeared on Level Up Coding - Medium and was authored by Ryan Chou


Print Share Comment Cite Upload Translate Updates
APA

Ryan Chou | Sciencx (2021-04-15T15:21:05+00:00) Visualize Linear Regression with Matplotlib, Pandas, and Sklearn. Retrieved from https://www.scien.cx/2021/04/15/visualize-linear-regression-with-matplotlib-pandas-and-sklearn/

MLA
" » Visualize Linear Regression with Matplotlib, Pandas, and Sklearn." Ryan Chou | Sciencx - Thursday April 15, 2021, https://www.scien.cx/2021/04/15/visualize-linear-regression-with-matplotlib-pandas-and-sklearn/
HARVARD
Ryan Chou | Sciencx Thursday April 15, 2021 » Visualize Linear Regression with Matplotlib, Pandas, and Sklearn., viewed ,<https://www.scien.cx/2021/04/15/visualize-linear-regression-with-matplotlib-pandas-and-sklearn/>
VANCOUVER
Ryan Chou | Sciencx - » Visualize Linear Regression with Matplotlib, Pandas, and Sklearn. [Internet]. [Accessed ]. Available from: https://www.scien.cx/2021/04/15/visualize-linear-regression-with-matplotlib-pandas-and-sklearn/
CHICAGO
" » Visualize Linear Regression with Matplotlib, Pandas, and Sklearn." Ryan Chou | Sciencx - Accessed . https://www.scien.cx/2021/04/15/visualize-linear-regression-with-matplotlib-pandas-and-sklearn/
IEEE
" » Visualize Linear Regression with Matplotlib, Pandas, and Sklearn." Ryan Chou | Sciencx [Online]. Available: https://www.scien.cx/2021/04/15/visualize-linear-regression-with-matplotlib-pandas-and-sklearn/. [Accessed: ]
rf:citation
» Visualize Linear Regression with Matplotlib, Pandas, and Sklearn | Ryan Chou | Sciencx | https://www.scien.cx/2021/04/15/visualize-linear-regression-with-matplotlib-pandas-and-sklearn/ |

Please log in to upload a file.


There are no updates yet.
Click the Upload button above to add an update.

You must be logged in to translate posts. Please log in or register.