This content originally appeared on Angular Blog - Medium and was authored by Minko Gechev
We’re thrilled to announce Angular DevTools — a Chrome DevTools extension that you can use to inspect the structure of your applications and profile their performance.
You can find more about Angular DevTools in the video below and install it from the Chrome Web Store.
Better Angular Debugging Experience
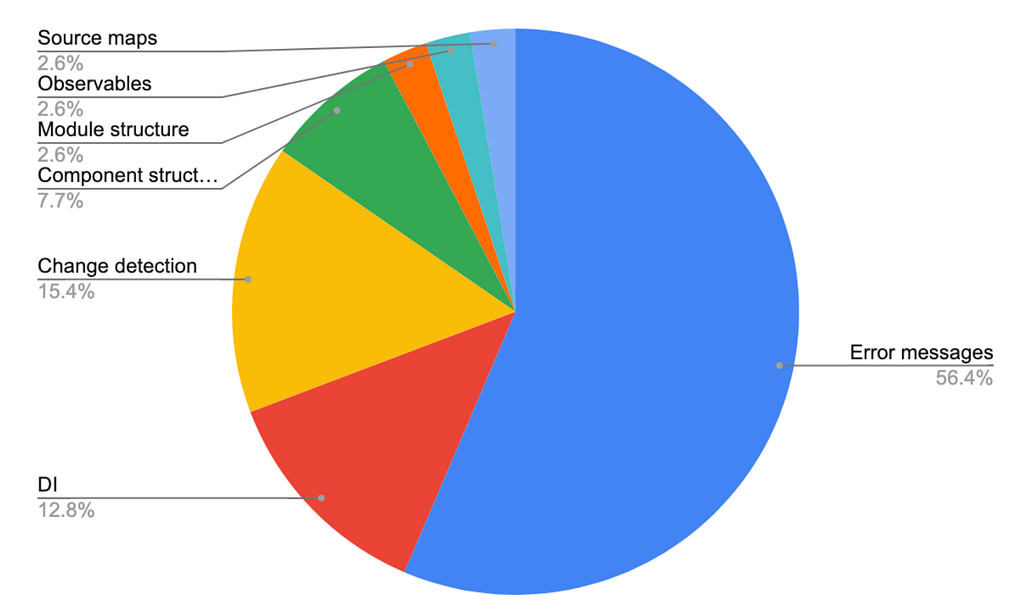
We ran a survey inside Google which confirmed the observations we’ve been getting from external developers — the majority of folks need better tools to debug their apps.

Based on the results we received from external and internal studies we identified the following areas which need the most attention:
- Improvements in error messages
- Understanding change detection execution
- Understanding injector hierarchy and provider instantiation
- Visualization of component structure
As part of the project to improve debugging experience, we introduced new APIs to the global ng object. We also worked on better Angular’s error messages by providing more information and actionable guidance on how to fix them. To give better insights to developers on how they can profile their apps, we provided content on profiling with Chrome DevTools.
Features of Angular DevTools
To address the remaining concerns and provide an Angular-specific view based on the Chrome DevTools features, we developed Angular DevTools in collaboration with Rangle.io. The team at Rangle built the very first debugging tool for Angular — Augury, which served the community for years. Working together we developed Angular DevTools from the ground up, reusing the lessons learned from Augury.
In its current release, Angular DevTools focuses on:
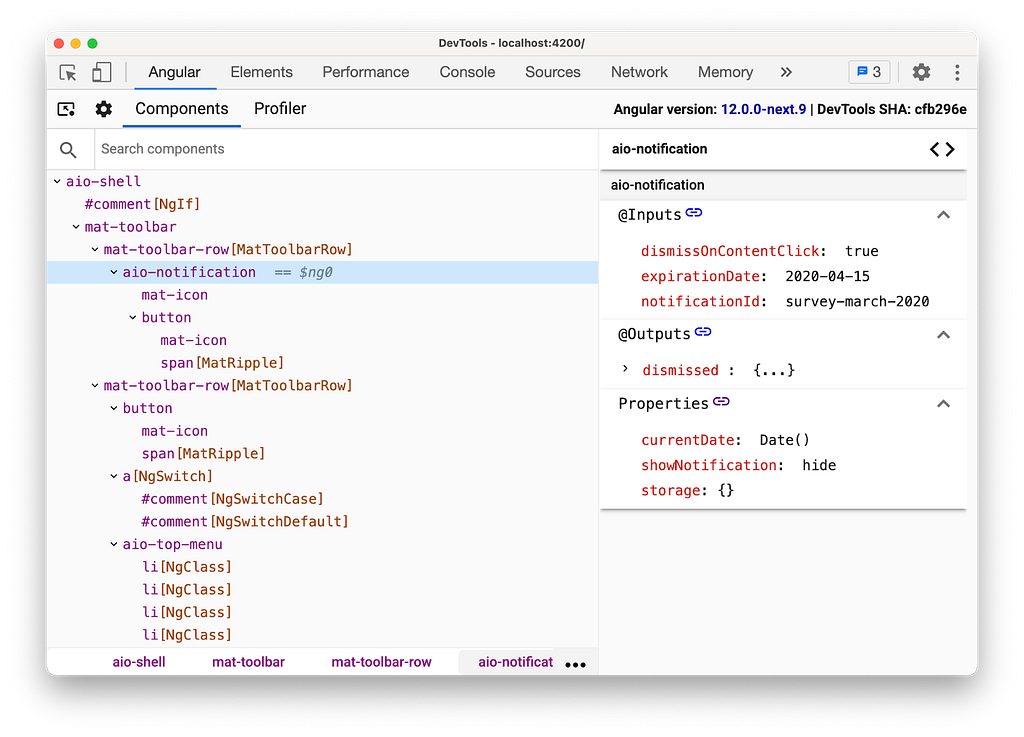
- Visualization of the component structure
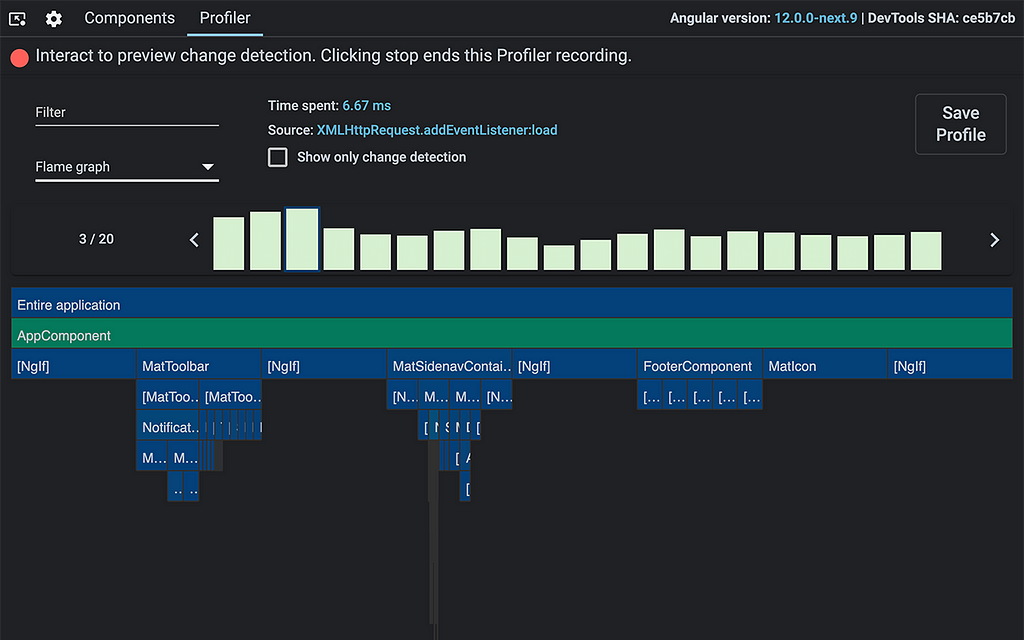
- Understanding the change detection execution
Similarly to Augury, Angular DevTools provides a component explorer that allow you to preview the structure of your application:

It also gives you an overview of the change detection cycles, helping you find what are the performance bottlenecks so you can deliver a 60fps experience to your users.

Angular DevTools supports applications built with Angular v9 and above with Ivy enabled.
Complete Development Toolchain
In Angular we’ve been working hard towards providing a complete toolchain for the modern Web developer. Together with the Angular CLI, language service, PWA tooling, and components, Angular DevTools provides an important missing piece that will help you better understand your application’s structure and runtime performance.
In the future releases of Angular DevTools we’ll be working on filling the functionality gap with Augury taking into account the most impactful features based on your requests. We’re delighted to share this work with you! We hope it’ll bring a higher level of confidence and transparency to your development process.
Special thanks go to Aleksander Bodurri and Sumit Arora who worked together with the Angular team on DevTools.
Introducing Angular DevTools was originally published in Angular Blog on Medium, where people are continuing the conversation by highlighting and responding to this story.
This content originally appeared on Angular Blog - Medium and was authored by Minko Gechev
Minko Gechev | Sciencx (2021-05-18T21:46:16+00:00) Introducing Angular DevTools. Retrieved from https://www.scien.cx/2021/05/18/introducing-angular-devtools/
Please log in to upload a file.
There are no updates yet.
Click the Upload button above to add an update.
