This content originally appeared on DEV Community and was authored by Peter Mekhaeil
There are so many articles online and so many techniques on improving site performance - where does one start on learning how to improve the performance of a website?
Going to break it into 3 sections that should be explored:
- Know your application
- Know your HTML
- Know your tools
Know your application
Your application is like a high-performance car owned by a motor sport team. How does the team improve their lap times? By improving the cars performance. How does the team improve the cars performance? By first knowing what is in your car.
Get to know what is in your application, get to know what is being bundled inside because the size of your script files will have an impact on performance and reducing bundle size is one of the first techniques I recommend to getting started on improving site performance. Most modern web applications are bundled with many dependencies and the first step in knowing what to improve is by first knowing what libraries are being imported into your application. Get curious about the size of your application.
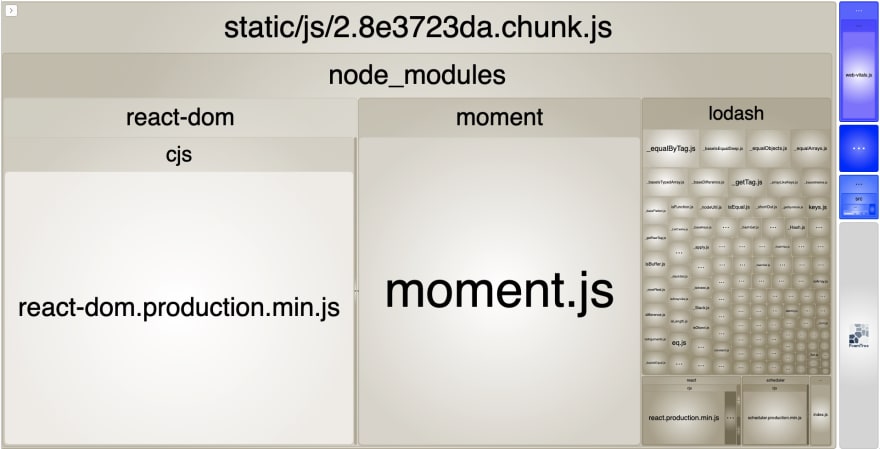
One of the first tools that I started using is webpack-bundle-analyzer. It generates a report of the output of your webpack build which visualises the filesize of your JavaScript files and what libraries are included in each file. Here is an example screenshot:
So we know what is in our application. What can we do with this information?
We can see lodash takes a large portion of the file. Lodash was one of the first libraries that got me interested in reducing bundle size because it was always included in projects when I first started in my software development career. This is where my curiosity kicked in - why was it so large every time, regardless of the functions that I was using?
After some researching, I came to learn that how you import your dependencies, and how your dependencies were build makes a difference. Using lodash as an example - the package is not tree-shakable. So instead of doing this:
import { difference, isEqual } from 'lodash';
Importing the features directly would avoid the complete package from being imported into the bundle:
import difference from 'lodash/difference';
import isEqual from 'lodash/isEqual';
You can see that instead of the whole package being imported, only the modules that were required are being imported.
This technique doesn't work for every library because it depends on how it is built. The idea here is - get curious about the size of your application. Understand the dependencies being imported and why are they are being imported. There could be better ways to import only the code you need for your application.
A great tool to help you know the size of a packages is Bundlephobia. It's great for times when you want to know the filesize cost of a package before importing it into your application. It also suggests similar libraries and the filesize comparison.
For example - if you look at the bundle report above, you will see moment being imported and it looks large enough for us to investigate if it can be reduced. Bundlephobia will suggest smaller packages:
Replacing moment with a dayjs, a much smaller alternative with very similar API:
By looking at the bundle size, I was able to drop the JavaScript filesize from 868.16 KB to 151.43 KB (83% smaller bundle!).
Small note: moment was a popular library before it went into maintenance mode - highly recommend you to start using the other alternative libraries instead.
Know your HTML
Let's go back to the basics. A HTML page has a head and body. The head is used for the "metadata" of the page, information that is not rendered. body is the document that is being rendered to the viewer.
<html>
  <head>
    <title>My Website</title>
    <script src="./fancy-script.js"></script>
    <link rel="stylesheet" href="./really-large-stylesheet.css" />
  </head>
  <body>
    <h1>Hello world!</h1>
    <p>Welcome to my little place in the web.</p>
  </body>
</html>
Where you place your JavaScript and stylesheets has an impact on how your page renders. The <script> and <link rel="stylesheet"> in the example above is considered render-blocking. Which means they must be loaded and processed before the browser renders the page.
Why is that? Because browsers follow rules to determine if a resource is render-blocking.
A web.dev article on Eliminate render-blocking resources explains perfectly the rules:
A
<script>tag that:
- Is in the
<head>of the document.- Does not have a
deferattribute.- Does not have an
asyncattribute.A
<link rel="stylesheet">tag that:
- Does not have a
disabledattribute. When this attribute is present, the browser does not download the stylesheet.- Does not have a
mediaattribute that matches the user's device.
With this knowledge and the techniques explains in the article - The HTML sample from above can be improved:
<html>
  <head>
    <title>My Website</title>
    <!-- Defer non critical scripts not required for first render -->
    <script src="./fancy-script.js" defer></script>
    <!-- Inline critical styling required for first render -->
    <style type="text/css">
      h1 {
        color: blue;
        font-weight: bold;
        text-align: center;
      }
    </style>
    <!-- Preload stylesheets not required for first render -->
    <link
      rel="preload"
      href="./non-critical-stylesheet.css"
      as="style"
      onload="this.onload=null;this.rel='stylesheet'"
    />
  </head>
  <body>
    <h1>Hello world!</h1>
    <p>Welcome to my little place in the web.</p>
  </body>
</html>
Take a look at the HTML source code of projects or your favourite websites and see if there are ways that the scripts and stylesheets can be re-arranged to improve the site performance. This can be a great way to get started and get familiar with how browsers handle resource requests.
Know your tools
Tools that can help you get started on improving site performance:
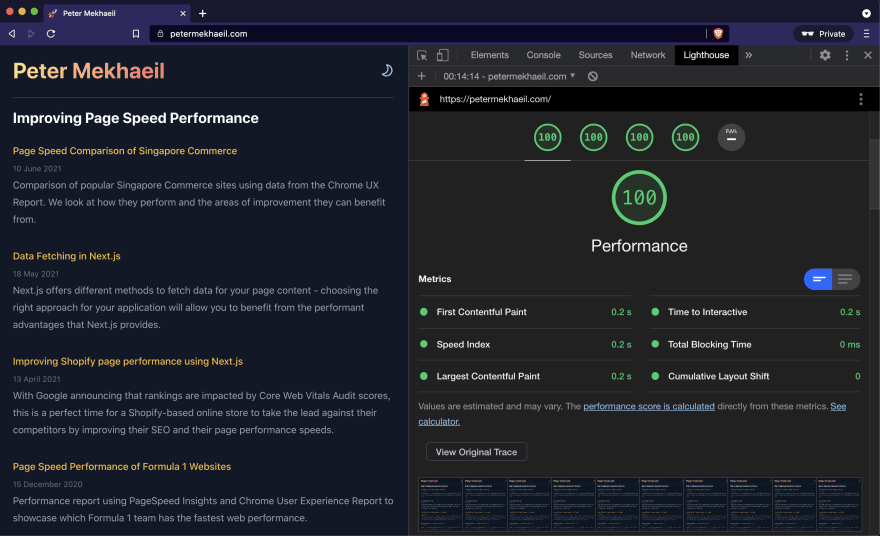
Google Lighthouse
Provides insights on best practices for your websites. It can run from Chrome DevTools or from a CLI. It scores your website on the Core Web Vitals and also provides suggestions on how to improve page load speed.
This is a great place to start. Run it on your own websites to get familiar with some of the suggestions reported and use them to explore many other techniques in improving performance. The suggestions also link to web.dev articles that go in details on why these suggestions are listed.
Lighthouse reports on Lab Data which means the scores may change each time depending on network conditions, so do remember to run it a few times before finalising any solutions.
PageSpeed Insights
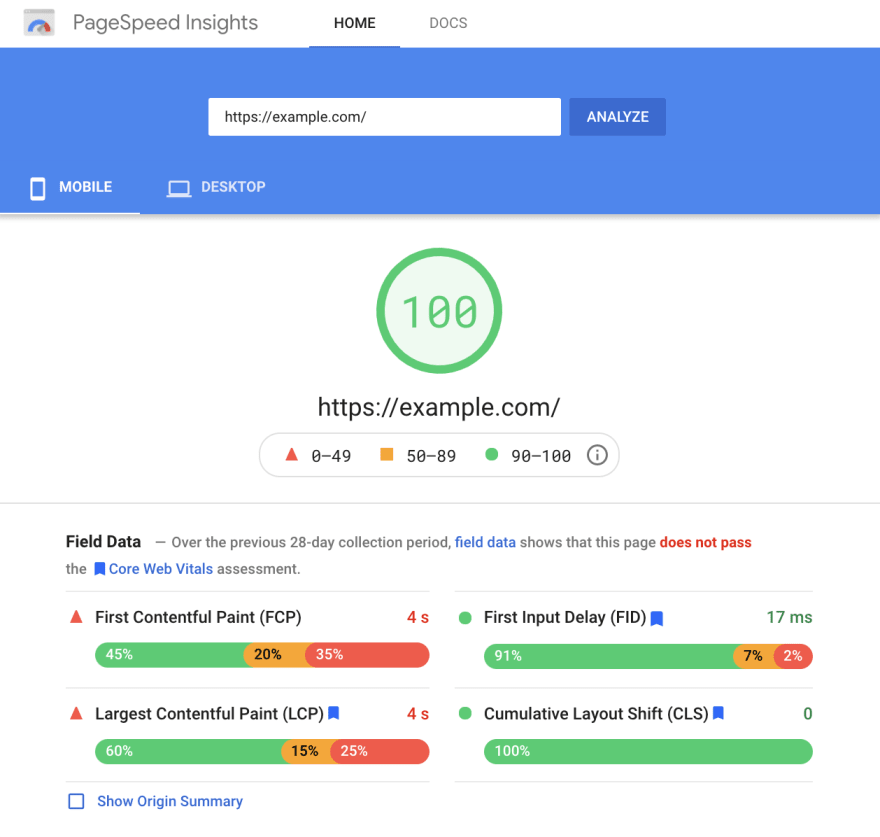
Analyses the performance of a website and generates a report that provides suggestions on what can be improved. It provides Lab Data powered by Google Lighthouse and is always updated when a new version of Lighthouse is released.
It also reports on Field Data from real users collected from Chrome UX Report, which is a great way to report on how your users are experiencing your website.
WebPageTest
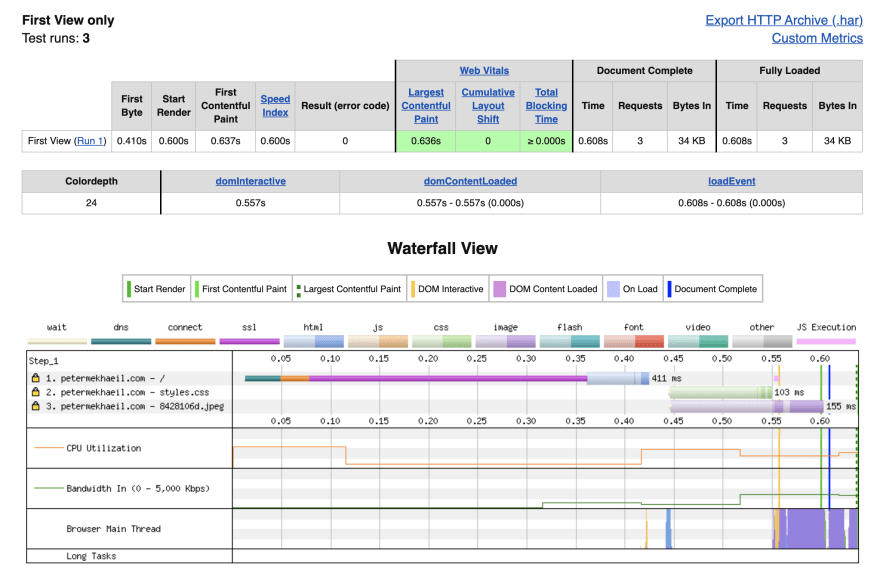
Measures your website performance using different locations, different browsers and different devices. It runs three tests and provides a summary which includes a waterfall view that chronological lists all the resources that were downloaded.
The other features that will come useful to you:
- Can generate videos comparison of how your website loads against other sites.
- Highlights which element on the page was the largest contentful paint.
- Generates videos of any layout shifts that occurs on your website.
The waterfall view is very useful in understanding the load times of each resources being downloaded and which were potentially blocking you from having a faster website. For example - when running a test on my site, we can see 2 resources were downloaded before first render:
I can improve the load times even further by inlining the critical styling and lazy loading the image because it is found at the bottom of the page.
I go a little further with WebPageTest in Page Speed Comparison of Singapore Commerce.
Where to go from here?
web.dev is a great place to learn everything you need on making your websites faster. Start with the Fast load times to learn techniques on improving site performance.
Once you got a hang over some of those techniques, take a look at the Metrics course to learn the metrics used to report on site performance.
When you are ready, head over to the Web Vitals course to learn all about the Core Web Vitals and why these metrics are important for a great user experience.
This content originally appeared on DEV Community and was authored by Peter Mekhaeil
Peter Mekhaeil | Sciencx (2021-06-18T00:00:00+00:00) How to get started with improving site performance. Retrieved from https://www.scien.cx/2021/06/18/how-to-get-started-with-improving-site-performance/
Please log in to upload a file.
There are no updates yet.
Click the Upload button above to add an update.


