This content originally appeared on Level Up Coding - Medium and was authored by Misty Liao
Can we accurately predict how an album will be scored by Anthony Fantano, one of the most well-known modern-day music critics?

In the modern-day world of music criticism, there is no one more well-known than Anthony Fantano, also known as “The Needle Drop” on YouTube and other social media platforms. Known for his humorous review videos and controversial takes on popular albums, over the years, Fantano has managed to amass a huge following with over 2.36M active subscribers on his main channel and 1.29M on his secondary channel.
With the rise of music criticism given popular music streaming services such as Spotify and Apple Music, it raises the question, what really makes an album 10/10? Especially with critics deemed as highly qualified, such as Fantano himself, it begs the question, what kinds of qualities or features make an album successful in the world of music criticism? In the following article, I aim to answer these questions by attempting to building a statistical regression model that can accurately predict how an album will score using Fantano’s reviews from 2010 to 2021.
Step 1. Data Collection & Preprocessing
Building the Initial Dataset
In order to build the most comprehensive dataset, I compiled together multiple datasources as many existing datasets containing Fantano’s reviews were outdated, usually containing reviews only up until 2018 or 2019, while more recent sources were not available in a preprocessed data format. In particular, I utilized a Kaggle dataset containing Fantano’s reviews up until 2018 as the foundation and built upon this existing dataset by web scraping Album of the Year’s ongoing record of Fantano’s reviews to get data from 2019 to present day 2021. For the initial dataset, the only features I directly extracted were the album name, artist, and review score.
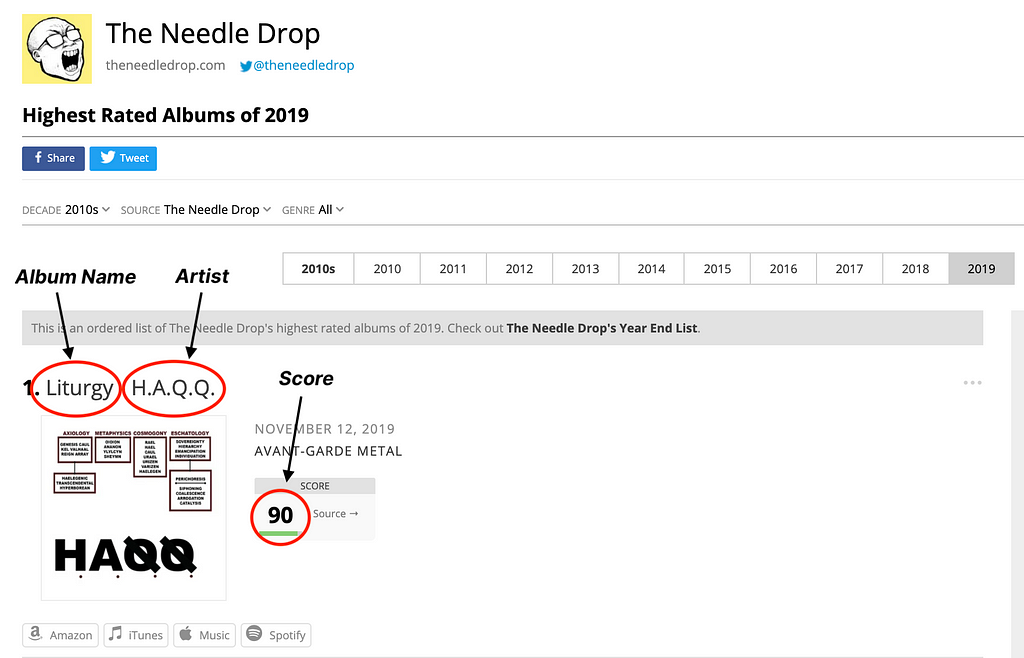
In order to extract the necessary information from Album of the Year, I used the rvest package, which allows for easy web scraping from HTMLs using selectors or XPath strings. Using the XPath of the HTML text elements associated with the album name, review score, and artist of each review item listed on AOTY, I was then able to retrieve all of Fantano’s reviews for the remaining 3 years and merge them with the existing Kaggle data to create a comprehensive dataset of all of the Needle Drop’s reviews from 2010 to 2021.
However, even after wrangling together our complete dataset, there were a lot of clear errors that occurred while scraping for data as well as differences in representation of certain attributes between the Kaggle review data and the web scraped review data. For example, as shown in the earlier figure, both the album name and artist were listed within the same HTML text element, requiring additional data cleaning to separate the two strings into distinct columns within our dataset. Data cleaning was an initial step within the data collection process and was conducted throughout, whether it be correcting for duplicate entries, removing rows with missing values, or determining how to handle differences in representation of a certain feature. After accounting for these errors, we were then able to move onto the next step; observing our data to determine what features might be useful for building our regression model and what additional features we can extract given our dataset.
Feature Extraction
In order to build a full model, we need more attributes to predict off of than just the artist name, album title, and score, especially given that score will be used as our intended response. As a result, we utilized the Spotify API to extract additional audio features for each album and combine it with our simple album data set in an attempt to isolate any features that might be useful for predicting Fantano’s scores. In specific, I used the spotifyr package, which was designed to make retrieving data from the Spotify API easier in R.
While retrieving data using the Spotify Web API and integrating into our merged dataset, there were a few challenges that arose:
- Aggregating audio features: First of all, given that albums themselves did not have many stored features apart from the artist name and total duration, I needed to determine the best way to aggregate the individual audio features of an album based on its tracks. For instance, while averaging out features such as ‘danceability’ and ‘loudness’, which are scored on a scale of 0 to 1, across an album’s individual tracks made sense, other features such as key or time signature were more categorical by nature, requiring a different aggregate function. Thus, for these non-numerical features, I initialized a function to retrieve the mode value of each feature and store that instead.
- Handling “Self-Titled” artists: Within the Kaggle dataset, there were also a significant amount of albums with the same name listed as “Self-Titled” used to indicate all albums which were named after the artist themselves. As a result, when making calls to the Spotify API, it was important to be weary of querying on the artist name rather than the album name of our dataset, as doing so would retrieve the incorrect information for all albums titled “Self-Titled” in our dataset.
- Differences in data formatting: Finally, the representation of certain data values differed between the Kaggle dataset and our web-scraped output. For example, scores in our web-scraped data were represented in multiples of 10 from 0 to 100 while scores in the Kaggle dataset were only represented on a scale fo 1 to 10. Minor errors such as these needed to be removed prior to proceeding with our data analysis to avoid misinterpretation or false results.
After resolving these data cleaning errors and successfully retrieving the aggregate audio features for each album, the final cleaned dataset consisted of 19 features (including our response variable, the review score) and 1,889 observations. The exact features and their associated data types are listed in the table as shown below:

Step 2. Exploratory Data Analysis
Before building our model, I wanted to gauge the distribution of the dataset in terms of certain key features and observe whether there were any clear associations between features or between features and our response variable. In particular, I used the following EDA to determine the appropriate model to use and begin to assess the relationship between the Needle Drop’s album review scores and the different attributes of a given album.
Distributions of Key Features
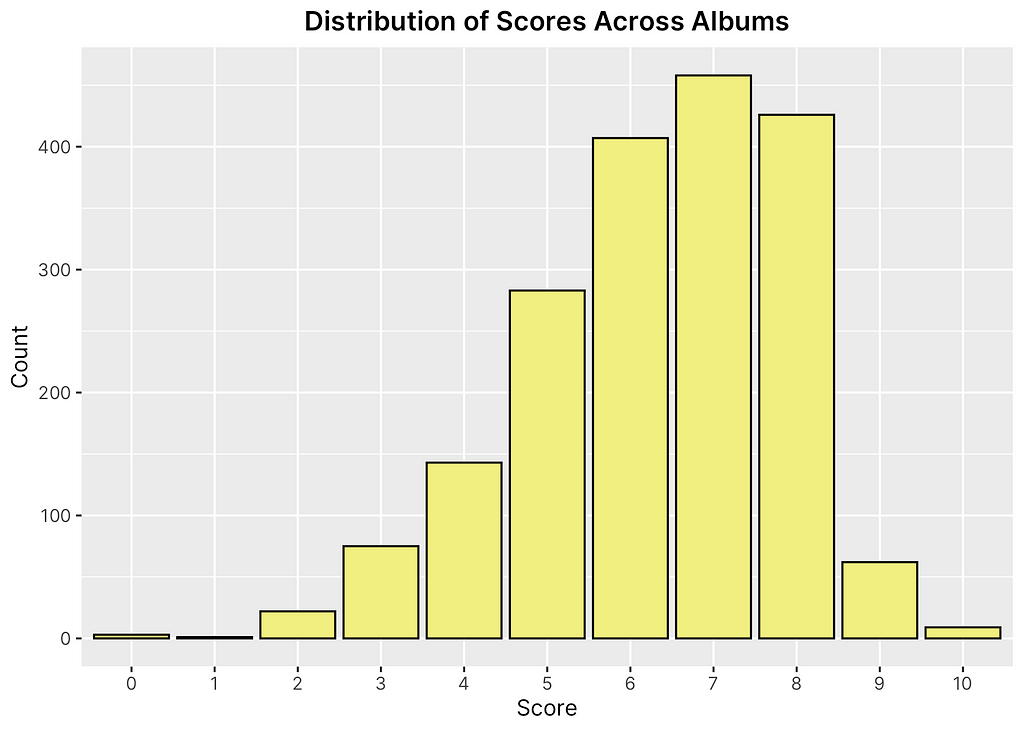
Observing the distribution of scores across albums first, as shown in Figure 2, it appears to be approximately normally distributed. This is to be expected as we would assume that a reputable music critic would primarily give reviews in the 5–7 range and rarely score albums in the lower bounds of 1–2 and higher bounds of 9–10 except for in extreme cases. It is slightly skewed left, however, this is also to be expected as most review scales tend to be skewed left slightly given the perceived view of a “6” or “7” being more along the lines of “sufficient” than a 5 or 4 as a 1–10 scale would seem to imply. We will keep the distribution of scores in mind when developing and interpreting our statistical model.
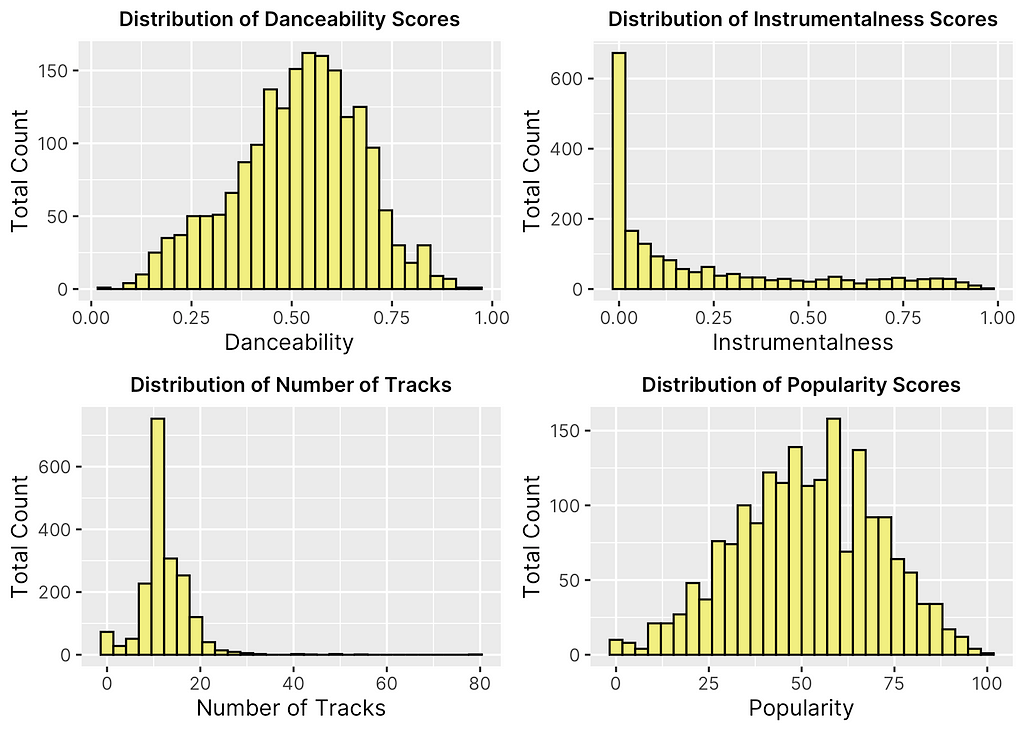
In addition to the distribution of Fantano’s scores, I also was interested in observing the distribution of all the key features of our model. The primary ones of interest are shown in Figure 3 above. Looking over these histograms, there are a few interesting things to note. First of all, it is interesting tot note that both popularity and danceability are normally distributed. This makes intuitive sense as Fantano tends to review a good amount of albums that are well-known in the public eye or already have generated a lot of publicity while also focusing on a few lesser known albums otherwise, creating a relatively normal distribution in the popularity of his rated albums. In addition, it appears that he focuses primarily on lyrical songs as opposed to heavy instrumental music as indicated by the distribution of “instrumentalness”, which was one of the audio features extracted using the Spotify Web API.
Throughout the EDA portion, I was mainly interested in seeing whether or not there was any observable biases in the way Fantano scored albums based on certain attributes. For instance, given his large appreciation for experimental hip hop and experimental genres, as noted by his few 10/10 album ratings including artists such as the Death Grips, Kendrick Lamar, and Swan, I was interested in seeing whether or not he held any subjective preferences for certain kinds of music that swayed him towards giving certain categories a higher or lower score. Outside of looking at key features, therefore, I decided to look at the distribution of artists he reviewed and observe whether or not there were any particular standouts in terms of frequency or average ratings.
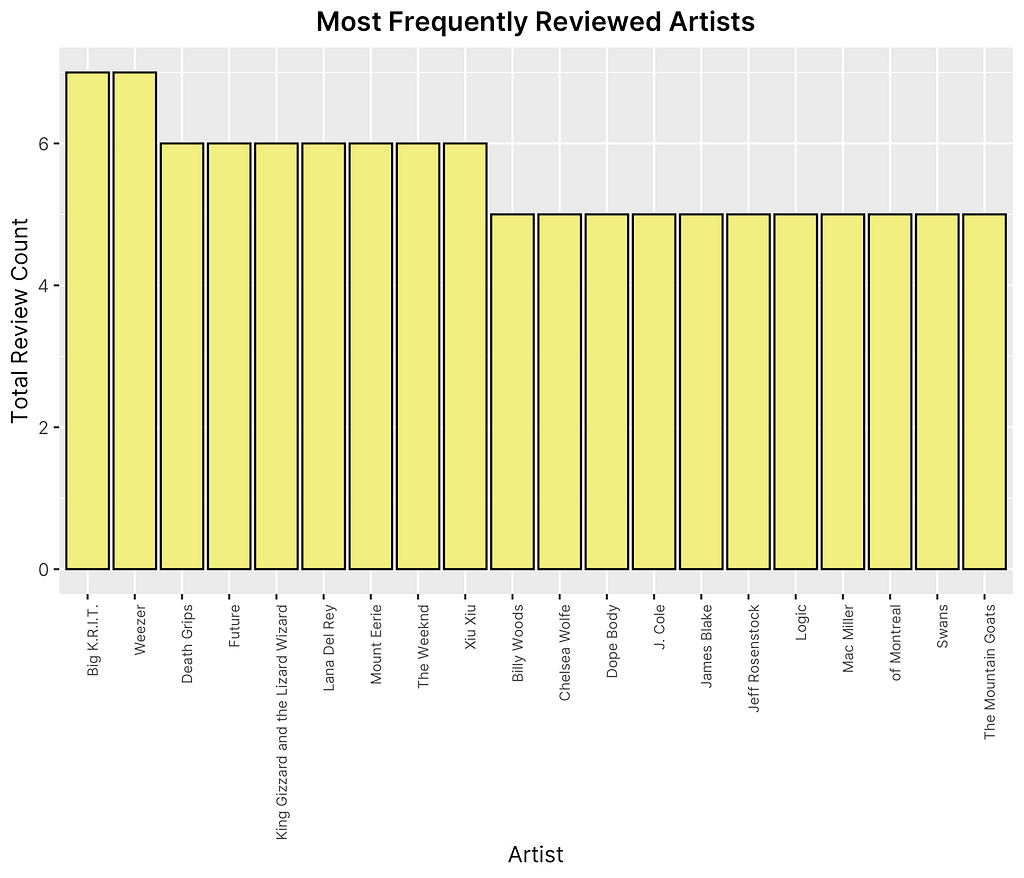
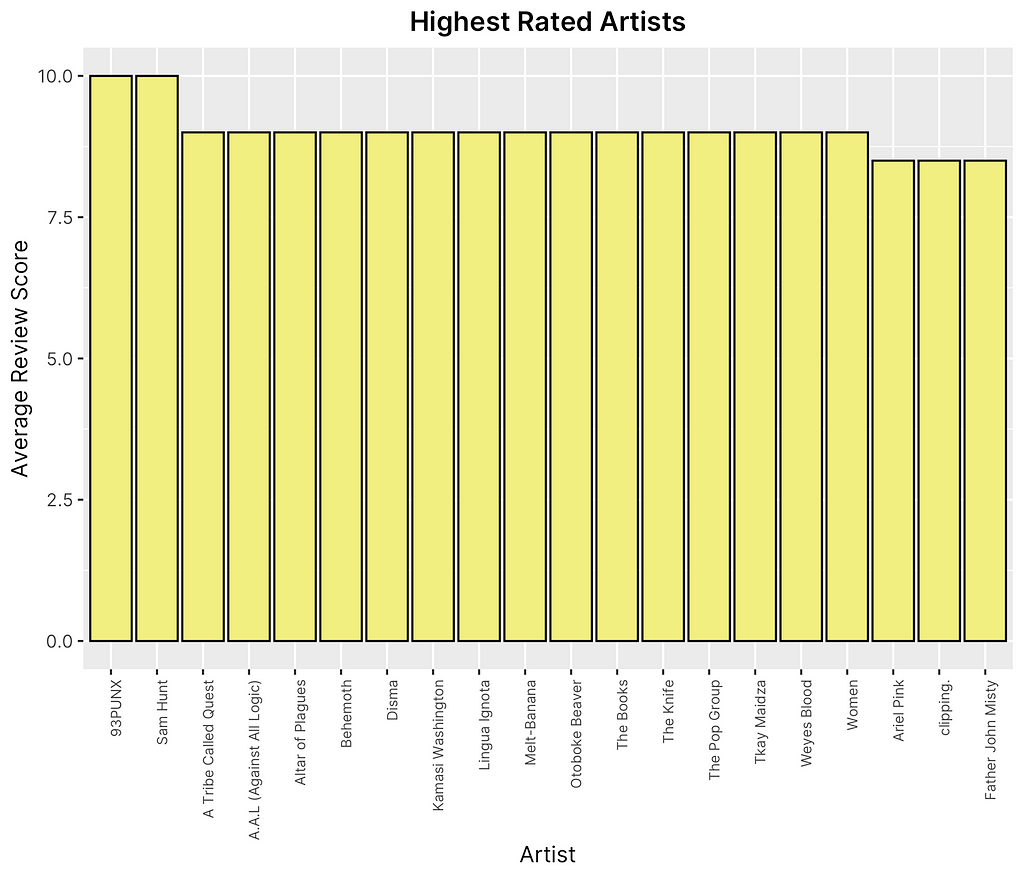
Looking at Figure 4 shown above, it appears that the top three artists he has reviewed the most are Big K.R.I.T, Weezer, and the Death Grips and the top three artists he has given the highest average rating to are 93PUNX, Sam Hunt, and A Tribe Called Quest. It is worth noting that the average rating and frequency of ratings could be largely dependent on the number of albums released by each artist, making these lists more indirectly interpretable. However, it does help to imply that overall, Fantano does not tend to lean towards a specific subset or category of artists, but rather seems to cover a broad scope of genres that would suggest less subjective bias to be present.
Plotting Against the Response
After drawing insights from the distributions of the dataset, I was then interested in seeing whether or not any feature had a clear relationship or association with score. In order to determine this, I plotted all 12 numeric features against the response, as shown in Figures 5, 6 & 7 below.
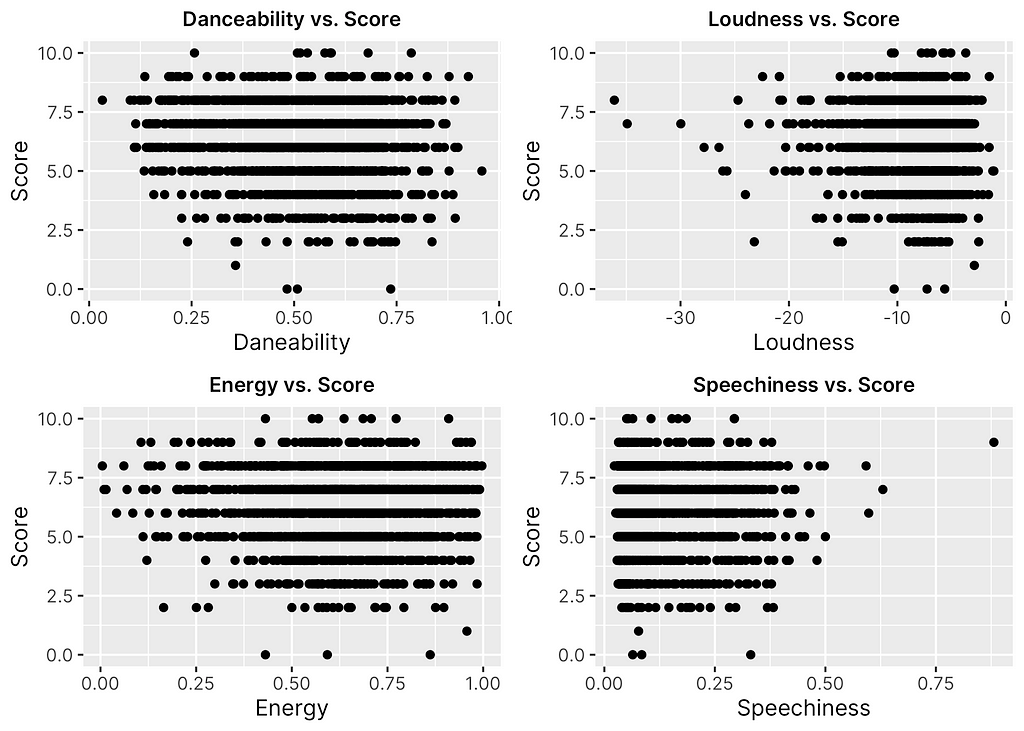
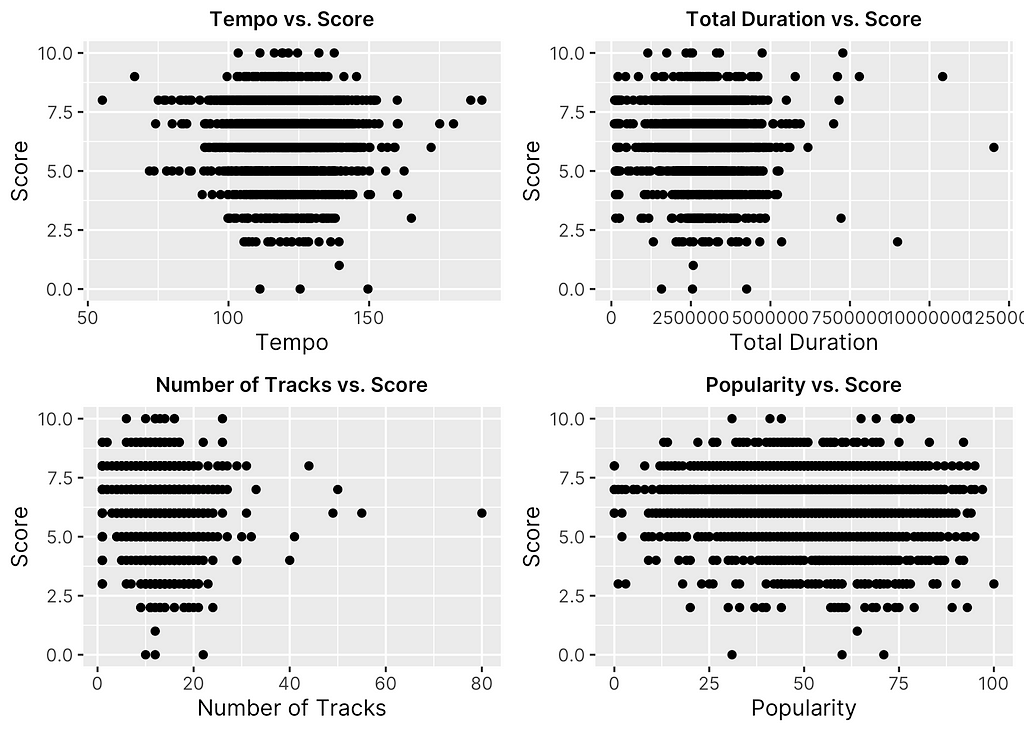
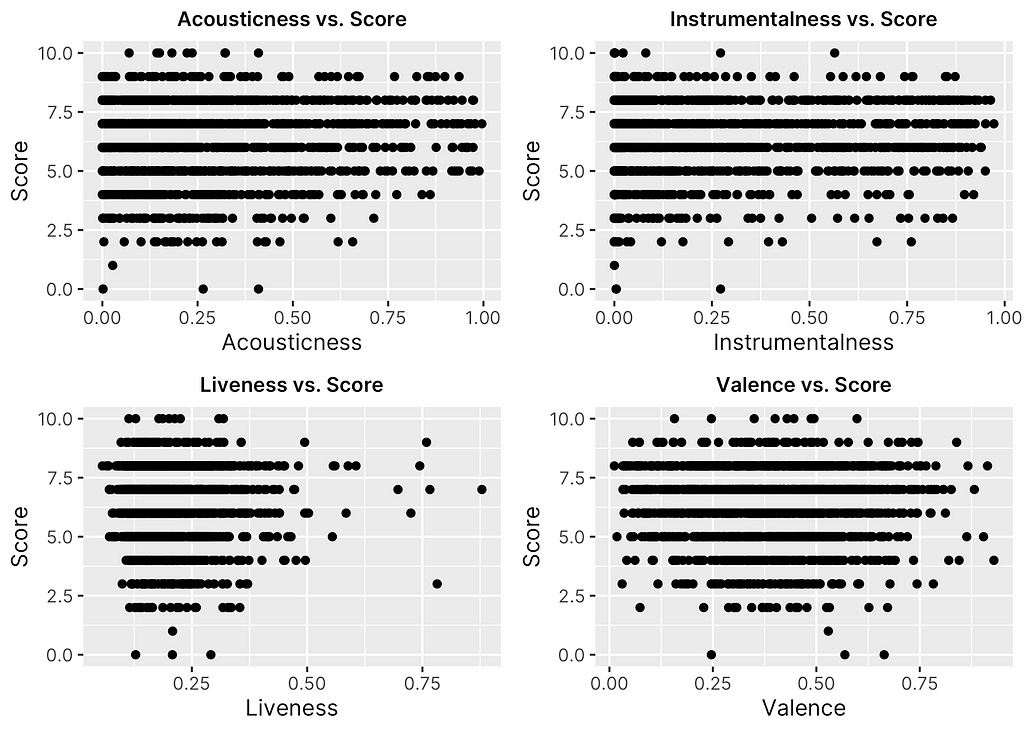
Given the nature of score as a discrete, ordinal variable, it is a little more difficult to assess the direct relationship using scatter plots. However, there are a few key trends worth noting. For one, it is clear to see that as a whole, Fantano tends to be relatively consistent in his scoring as most plots show a somewhat normal distribution of points across score values similar to the distribution of scores themselves as was viewed before. In addition, it is clear that certain features as a whole make are more common among the albums Fantano rates as a whole, such as albums with less “speechiness” and “loudness” and somewhat high “danceability” and “popularity”.
Observing Pairwise Correlations
Finally, in order to put the relationship between our features and the review score into a more interpretable format, I created a correlation matrix heatmap showing the pairwise correlations between features as well as between each feature and the response (“score”). Correlation matrices are particularly helpful for getting a general sense of whether there exists any strong relationships or whether features might be highly correlated with one another, which is important to be aware in the case of statistical modeling to avoid multicollinearity.
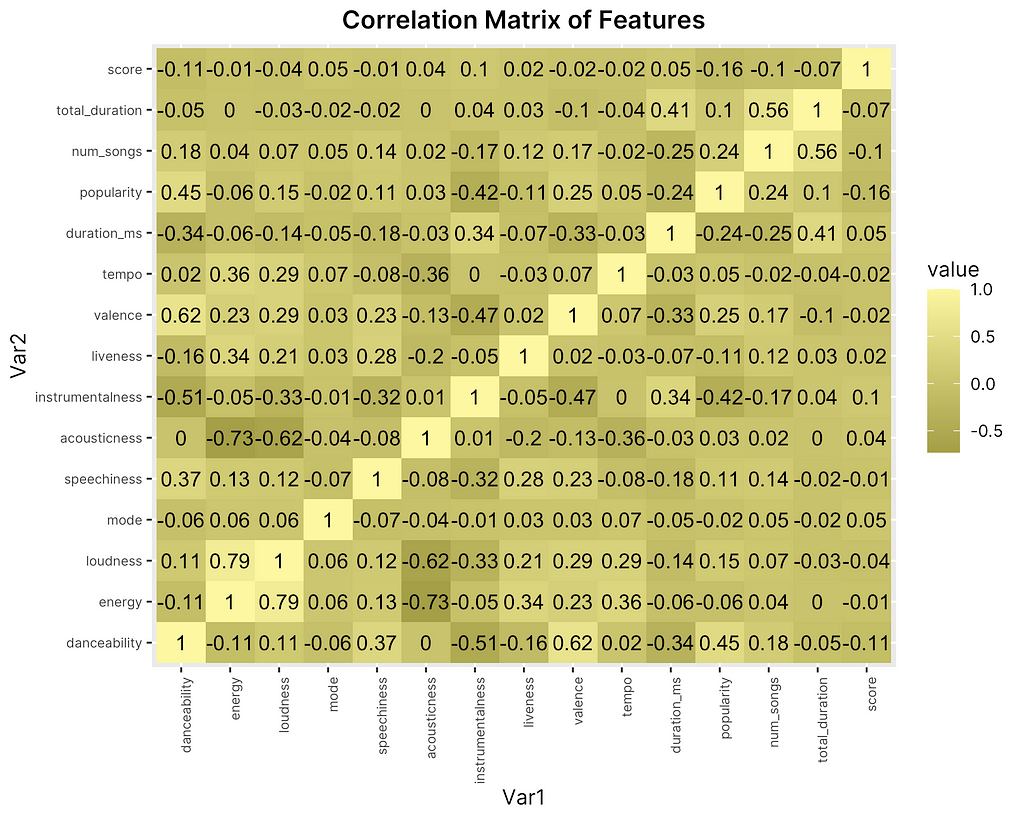
As indicated by the values in Figure 8, overall there does not seem to be many outstanding correlations between features and with the response as none seem to exceed the usual threshold for multicollinearity of 0.8. However, there are a few standouts, such as the strong negative correlation between “acousticness” and both “energy” and “loudness as well as the positive correlation between “energy” and“loudness”. This makes sense as both audio features seem to measure similar things about a track or seem to go hand in hand with one another intuitively. Observing the relationship between features and the response, however, there appears to be very little correlation. While this appears to insinuate that it may be difficult to predict Fantano’s review scores using our given dataset and its respective features, it is worth noting that the smaller correlation values between key features and the response does not mean a model will not provide useful insights. We take these trends and insights into account in the final stage of the report: building a regression model for predicting Fantano’s review scores.
Step 3. Statistical Modeling
One main consideration that was taken into account prior to building a statistical model was determining the best way to represent and predict the response. The case of album review scores in particular is interesting as the score values are reported on a discrete scale, but with ordinal meaning, meaning that each number could be interpreted as higher or lower than some other score at equal intervals, but could only be reported in the format of a whole numbers. This made me question whether or not it would be more suitable to run a regression model or classification model, as both offer certain benefits.
For the case of regression, the main benefit would be the interpretability of the end model and feature coefficients in comparison to a classification model. In specific, a regression model would take into account the relationship between score values and develop a model that would be able to predict scores with the understanding that each feature may produce a higher or lower score depending on its value. However, it could be that our predictive model will be able to predict scores better by classifying them into categories based on the main kinds of features that lead specifically to a “10” album vs. a “7” album.
Given that the purpose of our analysis is not only to predict Fantano’s scores, but to understand the relationship between each feature in producing a higher or lower score as well as identifying potential biases in his scoring approach, I decided that a regression model would be better suited.
Baseline Modeling
Before committing to our actual regression, I decided to build a baseline regression model for the sake of comparison against alternative models. As we saw in the EDA section, there is a significantly greater amount of observations in the 5–7 score range in comparison to the <5 or >7 ranges. In specific, out of all potential score values, there are the most reviews with a rating of 6. Given this, I wanted to see how a model that predicted a value of 6 on every single album would perform. After partitioning the data into an 80/20 training-test split and calculating the residuals between the predicted and actual values (assuming every prediction is 6), I found the root mean squared error of the baseline model to be 1.6499.
Multiple Linear Regression
Next, I created a linear model using all of the numeric features of the training data partitioned from before and the review score as the response. The summary output of is shown in Figure 9 below.
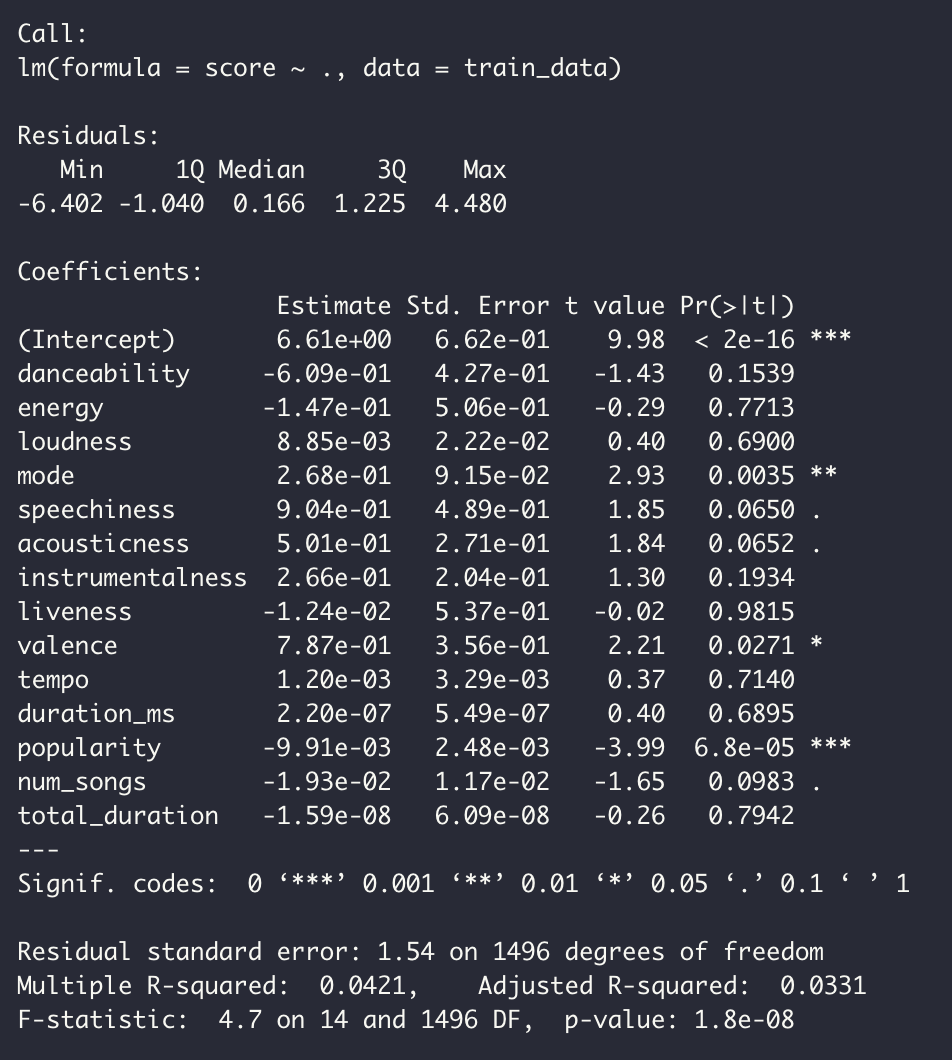
Looking at the outputted results, it appears that only some features are statistically significant at the 0.05 level, including the mode, valence, and popularity. Observing the estimated coefficients of each feature from the linear regression model in Figure 10, it appears that even while some features such as valence are evaluated as statistically significant, their coefficients are small enough to have only marginal effects on the final response. In addition, the model does not seem to cover much of the variance in the data, as indicated by the low adjusted R-squared value. However, when recalculating the root mean squared error, we find a slight improvement from our baseline model of 1.58.
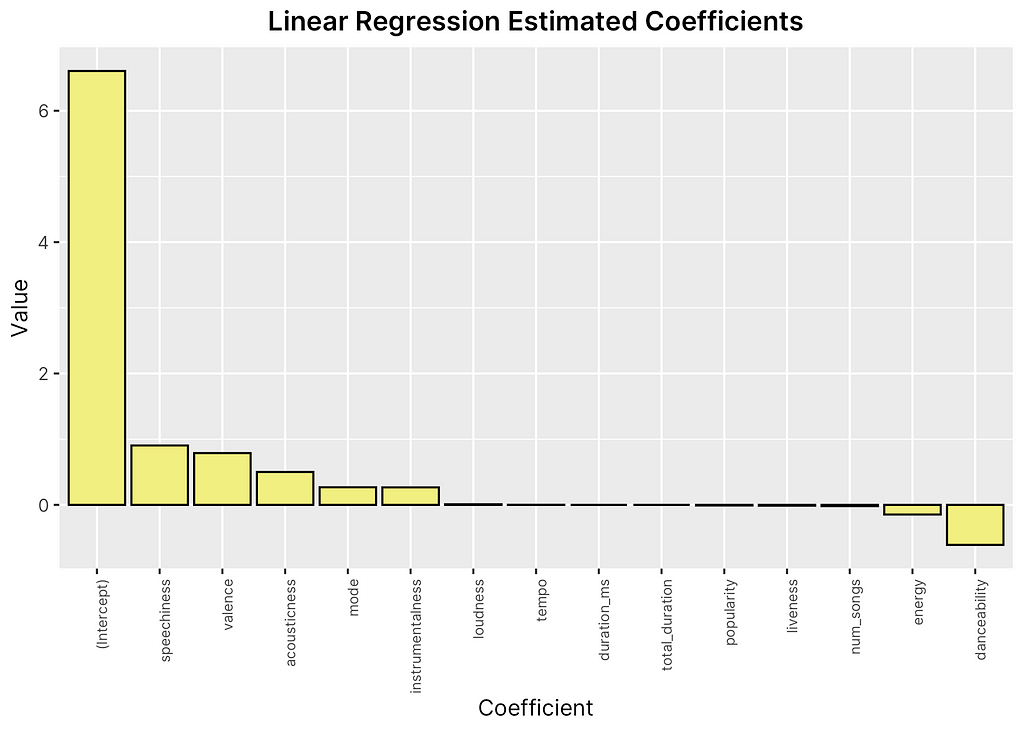
In the final step, we will attempt to improve upon our baseline and basic linear regression model using stepwise regression, a method that incorporates feature selection into regression.
Stepwise Regression
Given that many of our features did not seem to be statistically significant in our initial model, I wanted to see whether we could improve our regression by removing unhelpful features or features that are highly correlated with one another. One technique for accomplishing this is to use stepwise regression, which attempts to find the best subset of features by iteratively adding and removing features based on how useful they are in predicting the response. For instance, we found in our EDA that some variables appeared to be highly correlated with one another, such as “energy” and “loudness”. Stepwise regression helps to test whether or not removing one or the other may help to improve our predictive model assuming they may be causing some multicollinearity issues or be negatively affecting our predictive accuracy. The output of the stepwise linear regression is shown in Figure 11 below.
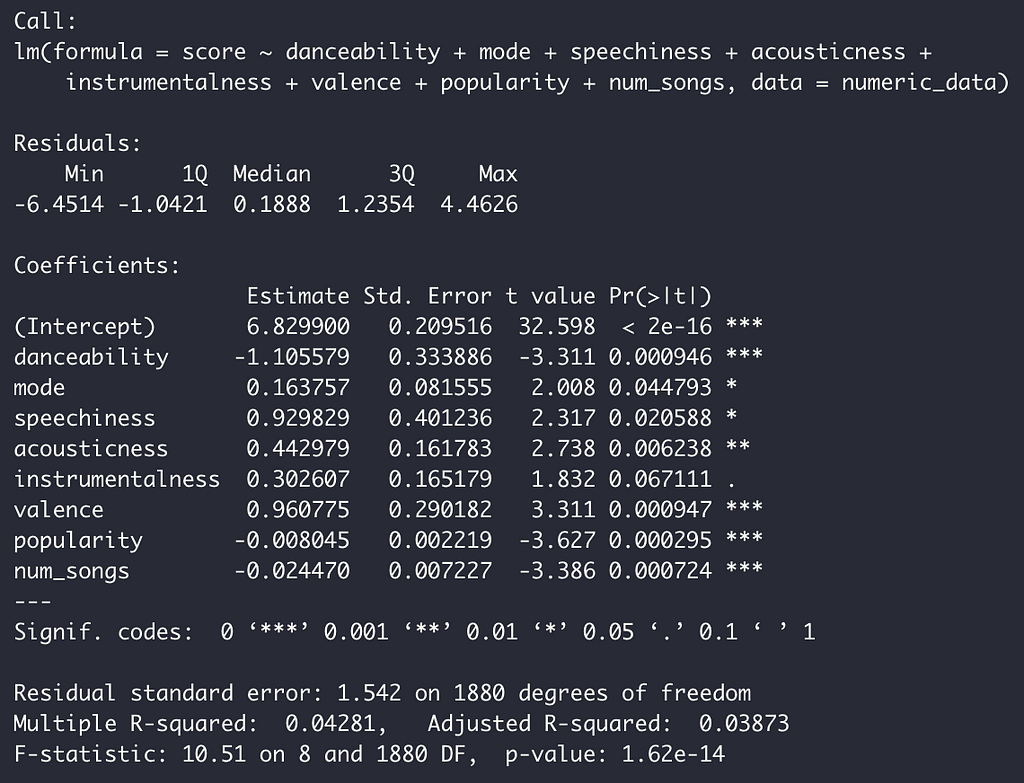
Comparing this against our initial regression, we can see that the stepwise regression has removed several of our features leaving only 8 of the 14 original ones left. In addition, we have improved our adjusted R-squared value slightly to 3.87%, although still very low for a predictive model. Recalculating the root mean squared error of our model, we see another marginal improvement with a new value of 1.56. In addition, looking at the feature importance plot against based on estimated coefficients, we can see that each variable influences the score much more significantly than before, demonstrating how stepwise regression aims to include only helpful coefficients.
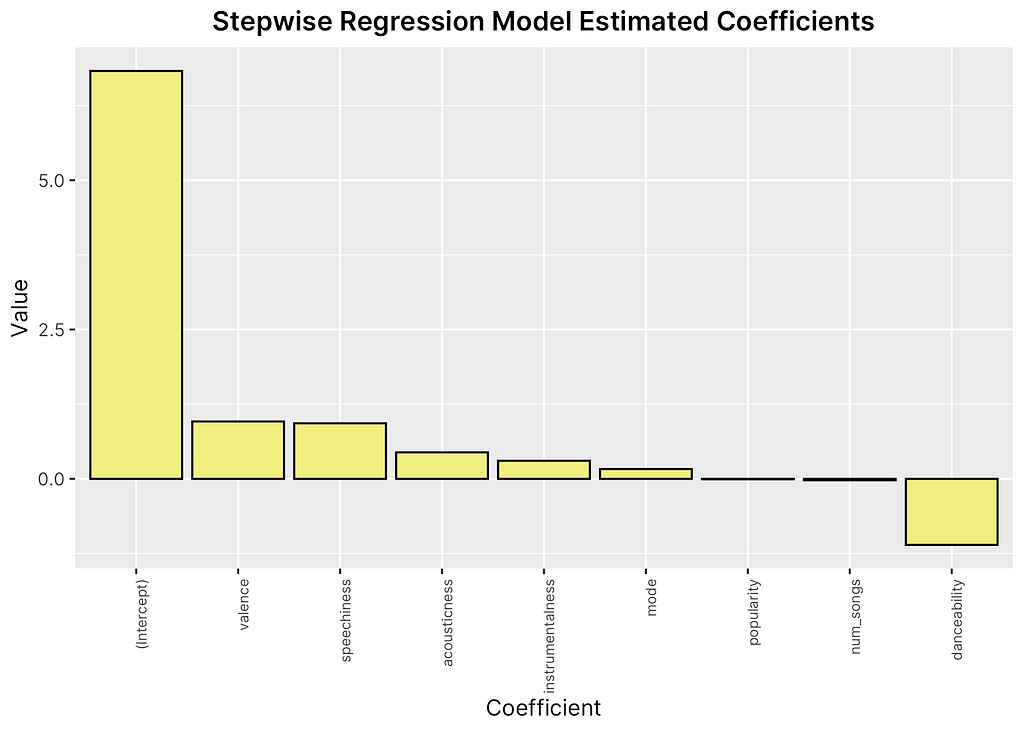
While the low R-squared value can be largely attributed to the normal distribution of scores and uneven balance between mid-range scores and high/low scores in our training set, it is clear that our predictive model does not achieve a very high level of accuracy given that the root mean squared error continues to fall around 1.5. This means that the standard deviation of our model on average is about 1.5 points off of the actual score, which is significant given the scale of 1 to 10. It is difficult to pinpoint the exact reasons as to why our predictive model is not able to improve much in accuracy without further investigation, however, it appears that our EDA might have been correct in indicating the need for more useful features that have a more direct relationship with our response.
Conclusion
The purpose of this report was twofold: to determine whether or not we could build a statistical model for predicting Anthony Fantano’s album review scores and to identify whether or not there were certain features that make an album more or less likely to be critically acclaimed, at least in the case of Fantano’s reviews. After conducting a significant amount of EDA and running two different regression models, it appears that Fantano’s reviews cannot be easily predicted based using just the audio features of an album, as were extracted from Spotify’s Web API.
Implications
This conclusion could have very interesting implications for both music listeners and critics; in particular, it may imply that the features that make an album “10/10 worthy” may extend beyond just the auditory experience or value of its tracks or may even include features that are immeasurable, such as the emotional value of a song by an individual listener, or that were not included in our model, such as the lyrics or themes involved.
In addition, it also suggests something very interesting about Anthony Fantano as a music critic (and also why he might be considered highly reputable); he appears to remain unbiased across audio features of different albums and does not tend to lean towards a higher or lower rating just based off of basic features, such as the popularity or loudness of a song. As a music critic, Fantano may be respected because of his ability to successfully view an album in its objective form without incorporating his own musical preferences for certain genres or artists.
For Further Investigation
While the results of our predictive models were not particularly significant, it does seem to indicate the potential for much more further investigation in the case of predicting music critic reviews. In particular, it would be interesting to incorporate non-auditory features into our dataset, such as the words of a song, the themes discussed, or the emotions evoked by a song. In addition, it would be interesting to build a similar model but with a different music critic or news source, such as Pitchfork, to see if similar trends arise or if the rating tendencies of critics differ significantly from one another.
What Makes a 10/10 Album? Using Regression to Predict the Needle Drop’s Album Reviews was originally published in Level Up Coding on Medium, where people are continuing the conversation by highlighting and responding to this story.
This content originally appeared on Level Up Coding - Medium and was authored by Misty Liao
Misty Liao | Sciencx (2021-06-18T14:45:22+00:00) What Makes a 10/10 Album? Using Regression to Predict the Needle Drop’s Album Reviews. Retrieved from https://www.scien.cx/2021/06/18/what-makes-a-10-10-album-using-regression-to-predict-the-needle-drops-album-reviews/
Please log in to upload a file.
There are no updates yet.
Click the Upload button above to add an update.
