This content originally appeared on Level Up Coding - Medium and was authored by Uddeshya Singh
Golang, Opentelemetry, and Sentry — The Underrated Distributed Tracing Stack
TL;DR. ?
I have made a mini instrumentation example on how to configure your golang application to use opentelemetry and pushing the acquired traces to a sentry backend. Here’s the Github link to it (you can find the steps to run the sample there itself)
uds5501/sentry-opentelemetry-example
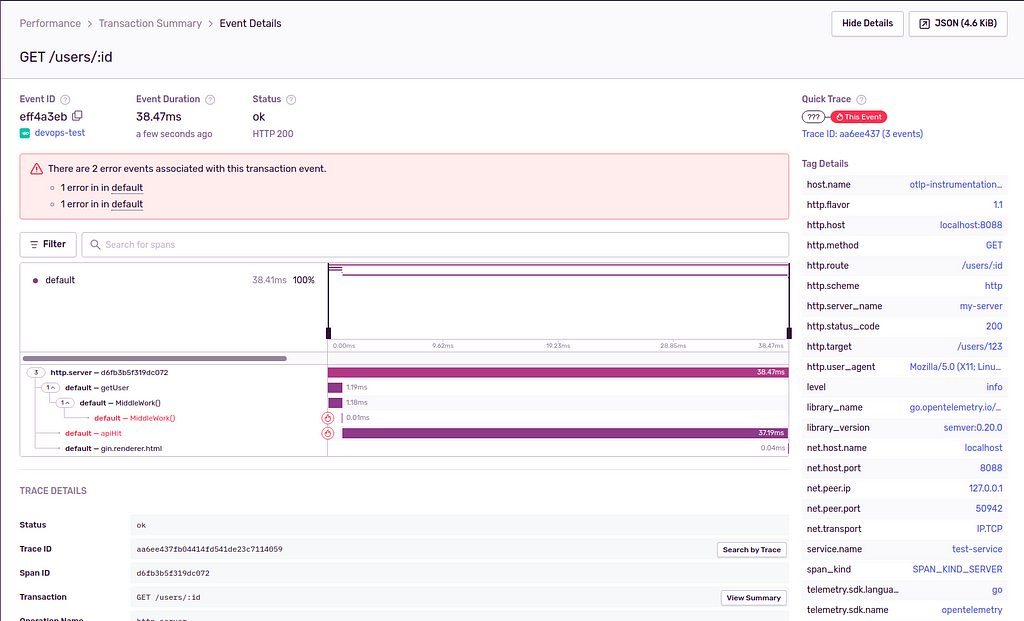
Introduction ?
Still here? Awesome!
Distributed tracing is an essential part of microservice architecture’s observability, tracking, and profiling. I won’t be diving too deep into the basic meaning of tracing and how does it work because there is an abundance of great resources on the same, If you need a concrete context on how does distributed tracing work I’d recommend Open Tracing’s article on Distributed Tracing to get a basic overview and Alois’ blog post on W3 Trace Context to elaborate better on how distributed tracing work.
Confusion with so many tracing backends ?
But there is one small inconsistency in this entire Tracing conundrum. While the Trace Context specifications and guidelines might’ve been declared, the instrumentation of applications still is widely “backend specific” issue. What I mean is, we have various back-ends which can visualise tracing such as Sentry, Jaeger, Google Cloud Tracing, New Relic, ElasticAPM so on and so forth. Each one of them has their own instrumentation SDKs.
Now suppose, today you decide to go with Elastic APM and instrument your microservice with their SDK and later on you decide that hey, this is too heavy, how about we switch to something lighter, let’s say like Jaeger / Sentry?
Whoops! You’ll have to re instrument the entire app using sentry / Jaeger specific SDKs and hence, will incur a huge technical overhead.
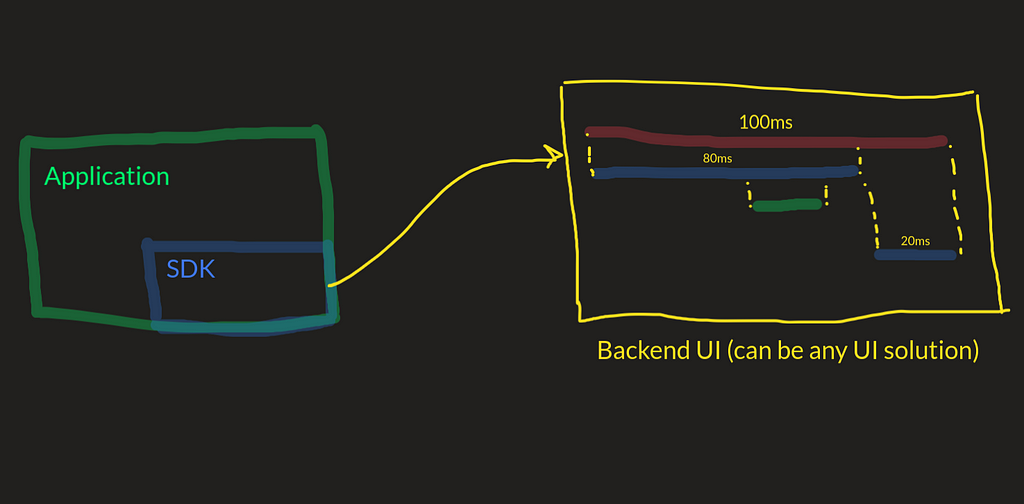
This is where OpenTelemetry comes in ?
With opentelemetry, one won’t have to re-instrument their entire application. Instead, we need to instrument our applications once with OpenTelemetry and this SDK will send over these traces to an “Open Telemetry Collector” which collects these traces and exports them to multiple backends at once.
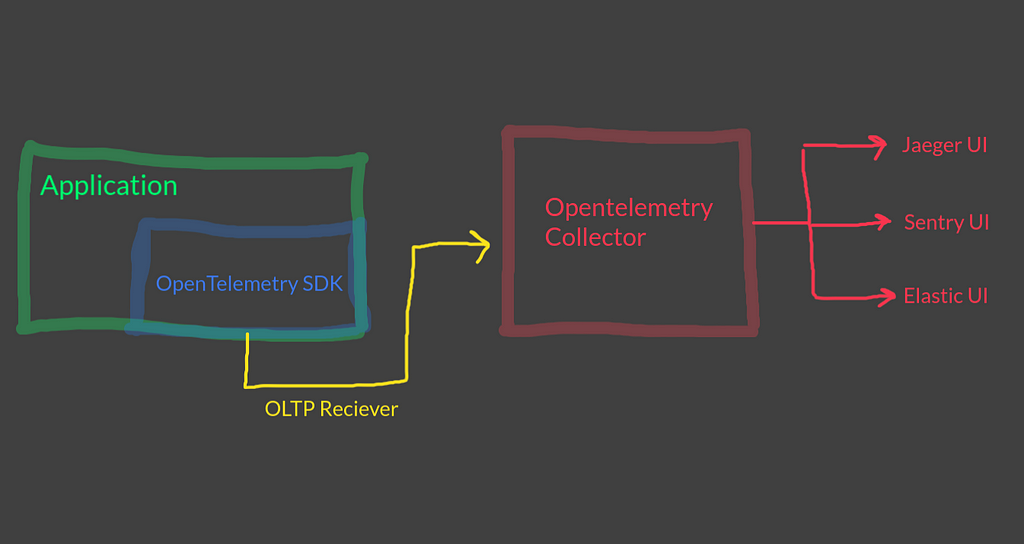
Why Sentry? ?
Like every observability stack, Sentry has its pros and cons. But looking specifically at Sentry for being a distributed traces UI, here are the pros which I specifically loved.
- It is comparatively compact and less resource intensive. Our organisation has been using New Relic and Elastic APM in the past and while they are full blown Logging + Tracing + Metrics support in themselves, they are heavily resource intensive and if you are really looking for just a good ol’ reliable, I would go for a sentry hosted on a simple EC2 machine instead of a full blown k8s cluster.
- Sentry is unmatched in its error management and alerting capabilities.
There are certain cons as well :
- To employ a stack trace capture for errors, you need to use their official SDK because currently, opentelemetry does not support impeccable stack trace captures themselves.
- Opentelemetry’s own logging is currently in beta and is in a frozen development state itself across multiple language-specific SDKs, so this combination is a miss in that respect.
Enough with theory, now how do I instrument my Golang Application? ⚒️
I used openetelemetry’s go sdk hosted on github and followed their documentation here for golang.
The entire instrumentation can be found in the main.go file in the initially mentioned github repository. Let me walk you step by step how do you go about the instrumentation of your application.
Initialise the tracer
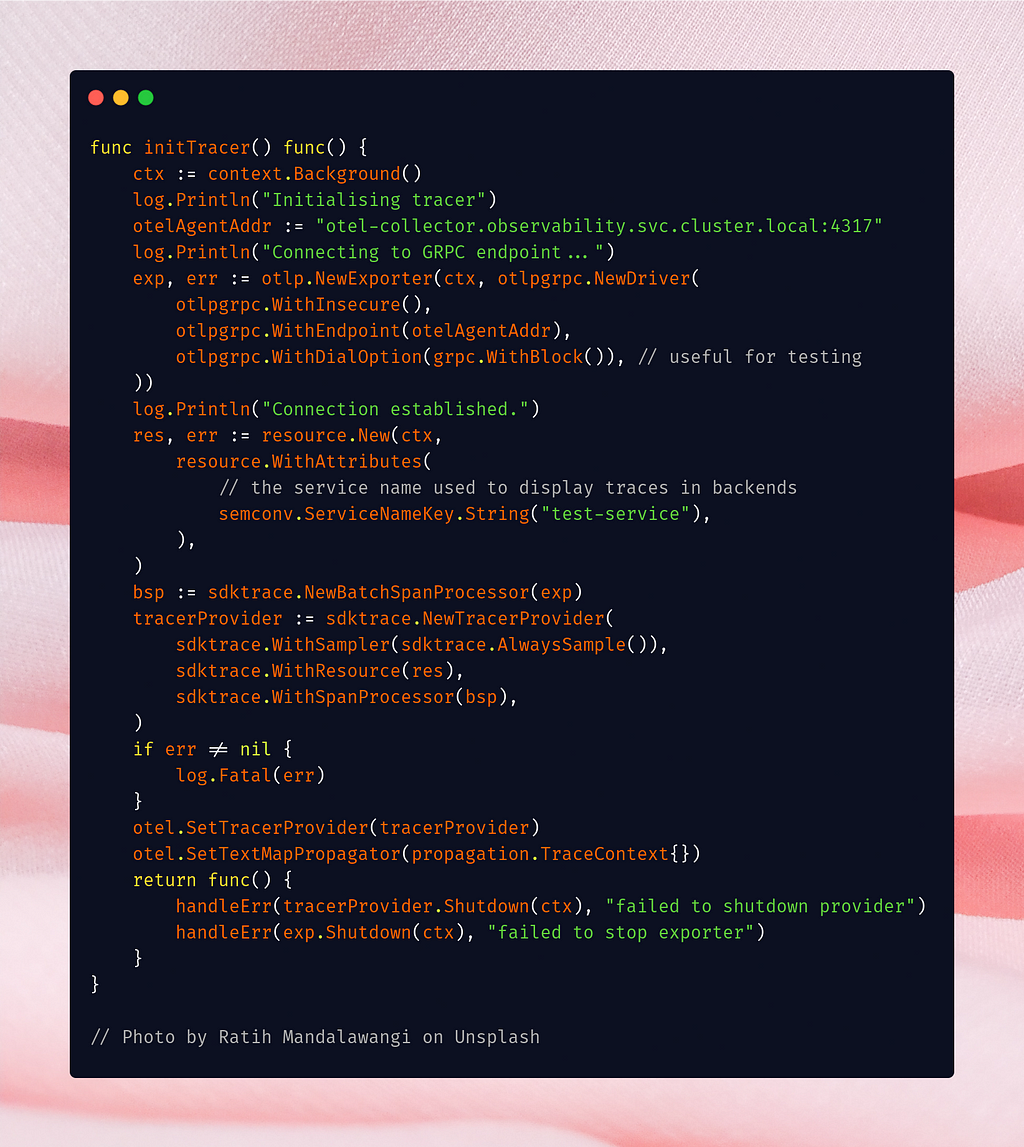
First one has to initialise the tracer which is handled in initTracer() method. It first creates a new exporter (OLTP exporter) which is connected to our collector’s port 4317 via GRPC protocol. (PSST... we are connecting to the collector via otel-collector.observability.svc.cluster.local:4317) which means, it is connecting to otel-collector service in observability namespace at port 4317)
Then we create a new resource to establish our service name (in this case, it is test-service).
Then a Span processor is acquired and finally we create a TracerProvider which is then globally set within our application . One interesting thing to notice is that we can determine how many traces should we sample, currently with AlwaysSample() we are commanding our tracer provider to always sample the traces.
This might be good for development environment, but in production, I’d suggest to go with a sampling rate of maybe 10–20% so as to not cause any technical debt in the system (traces are often quite heavy).
Start. Stop. Propagate.
Now, our basic tracer provider is ready, lets begin understanding how exactly we start, stop and record events in a span, golang way.
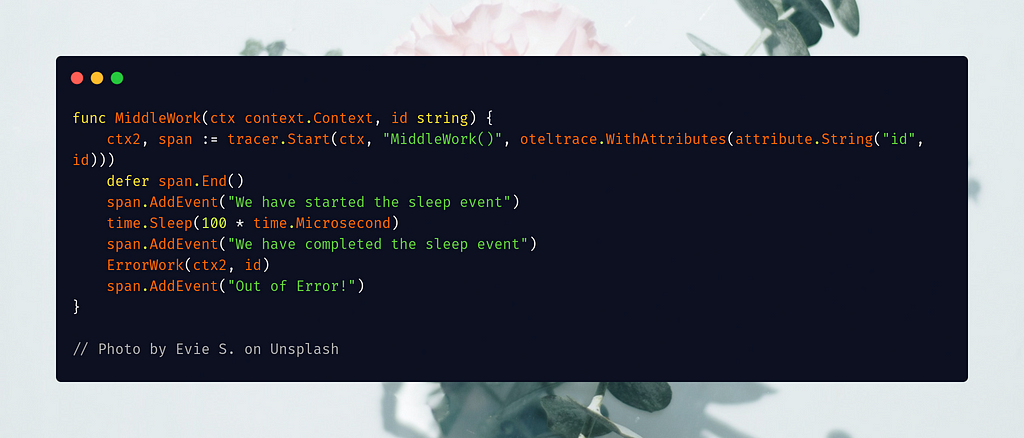
You can find this function in somework/service.go . The tracer.Start() method marks the beginning of a span and span.End() ends a span. We can add events and record errors within a span at some time using span.AddEvent() and span.RecordError() respectively.
To pass the span context to some other function, all you need to do is to pass the current span context (in this case ctx2 ) into the next function. Here is how it was done in ErrorWork() function.
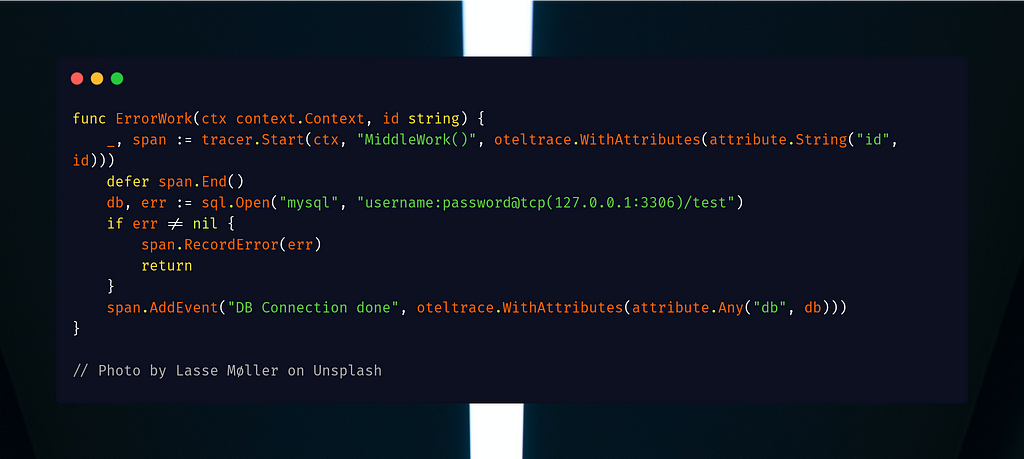
Setting up the opentelemetry collector and exporter. ?
This is actually the easy part, you need to setup 3 things in a config file.
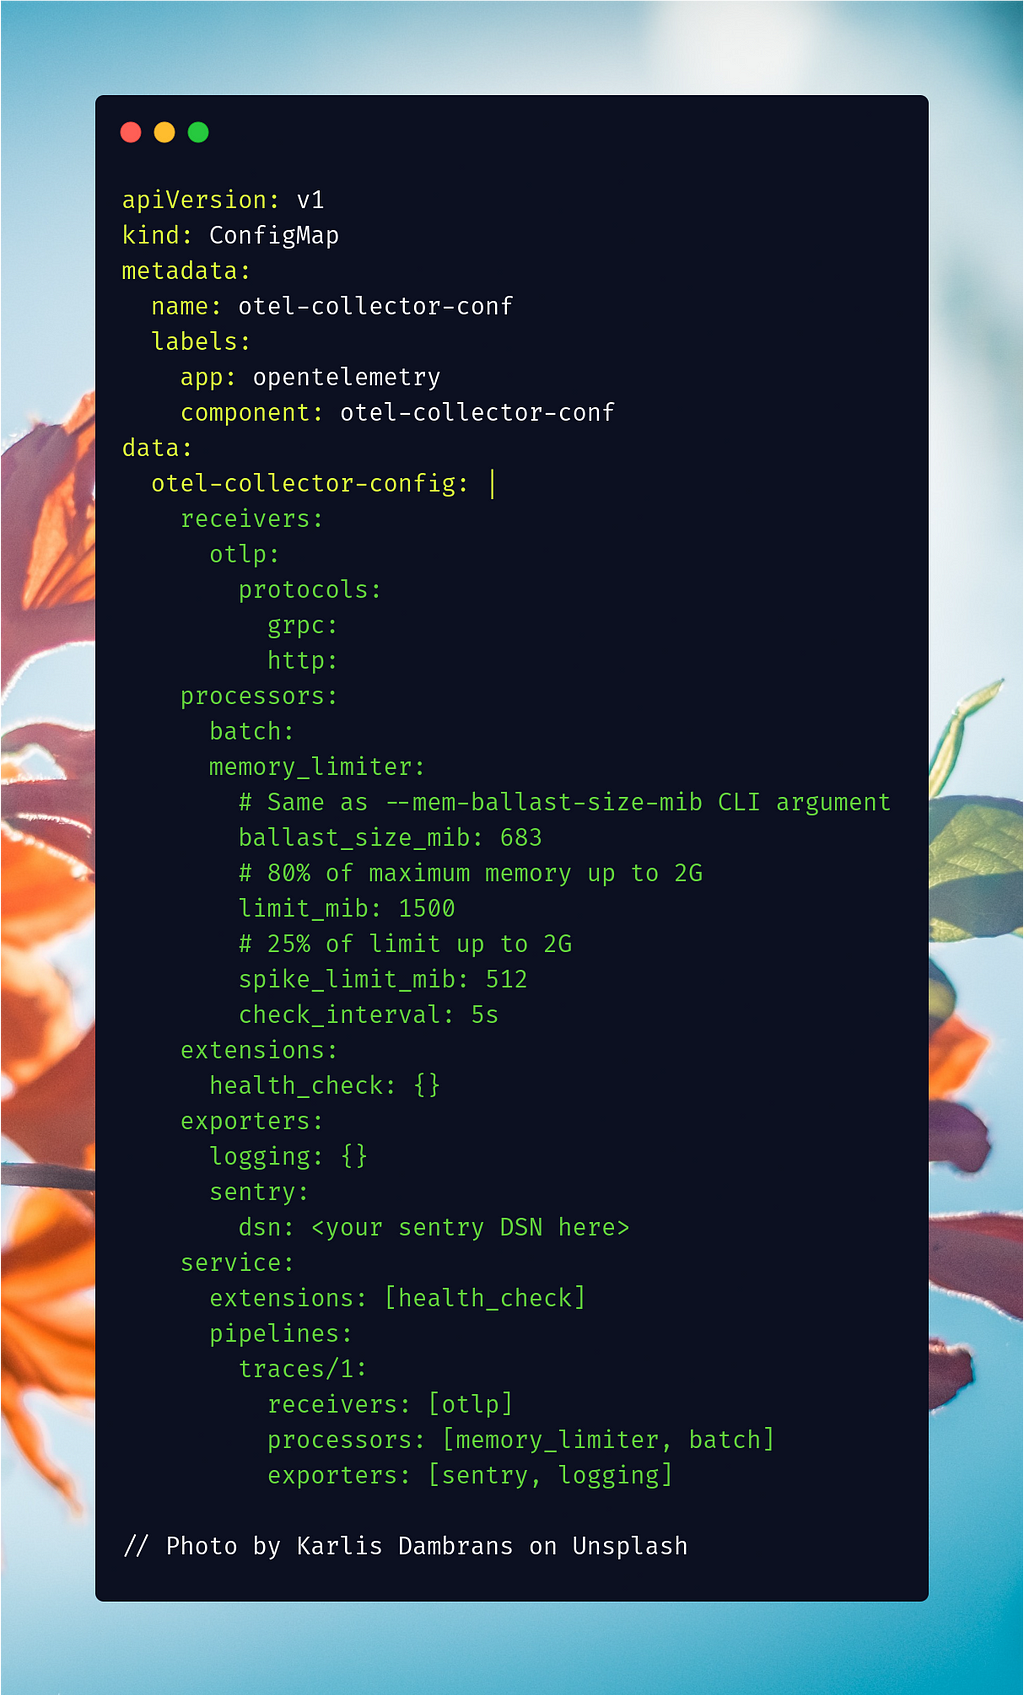
First, we configure the receivers, that is, this is where the SDK exporter will push the traces to. Here we are allowing oltp receiver with both grpc and http protocol (with default port of 4317, if not mentioned)
Then you need some processors and extensions, I have used memory_limiter and batch processor to ensure my collector does not overshoot spike of 512 mib and memory limit of 1500 mib.
Now, you setup your exporter. You can configure multiple exporters at once, like here, I have configured a logging exporter (which exports the traces to pod’s terminal) and the sentry exporter which exports the traces to sentry UI simultaneously.
Done with these 3? Now all we gotta do is create a pipeline, which has a receiver, processor and exporter and Tada!
Resources ?
- Opentelemetry Docs
- Opentelemetry Collector Github
- Sentry Distributed Tracing
- Github Instrumentation Repository
Golang, Opentelemetry, and Sentry — The Underrated Distributed Tracing Stack was originally published in Level Up Coding on Medium, where people are continuing the conversation by highlighting and responding to this story.
This content originally appeared on Level Up Coding - Medium and was authored by Uddeshya Singh
Uddeshya Singh | Sciencx (2021-06-21T16:43:11+00:00) Golang, Opentelemetry, and Sentry — The Underrated Distributed Tracing Stack. Retrieved from https://www.scien.cx/2021/06/21/golang-opentelemetry-and-sentry%e2%80%8a-%e2%80%8athe-underrated-distributed-tracing-stack/
Please log in to upload a file.
There are no updates yet.
Click the Upload button above to add an update.
