
This content originally appeared on DEV Community and was authored by Daniel Kim
As systems become increasingly complex, it’s increasingly important to get visibility into the inner workings of systems to increase performance and reliability. Distributed tracing shows how each request passes through the application, giving developers context to resolve incidents, showing what parts of their system are slow or broken.
A single trace typically shows the activity for an individual transaction or request within the application being monitored, from the browser or mobile device down through to the database and back. In aggregate, a collection of traces can show which backend service or database is having the biggest impact on performance as it affects your users’ experiences.
That’s pretty abstract, right? So let’s zero in on a specific example to help clarify things. We’ll use OpenTelemetry to generate and view traces from a small sample application.
Spinning up our Movies App
We have written a simple application consisting of two microservices, movies and dashboard. The movies service provides the name of movies and their genre in JSON format, while the dashboard service returns the results from the movies service.
To spin up the app, run
$ npm i
$ node dashboard.js
$ node movies.js
Notice the variable delay, built into the movies microservice that causes random delays returning the JSON.
const express = require('express')
const app = express()
const port = 3000

app.get('/movies', async function (req, res) {
   res.type('json')
+  var delay = Math.floor( ( Math.random() * 2000 ) + 100);
+  setTimeout((() => {
      res.send(({movies: [
         { name: 'Jaws', genre: 'Thriller'},
         { name: 'Annie', genre: 'Family'},
         { name: 'Jurassic Park', genre: 'Action'},
      ]}))
+  }), delay)
})
Tracing HTTP Requests with Open Telemetry
An OpenTelemetry tracer works by attaching trace IDs to Outgoing HTTP requests and incoming HTTP requests look-for-or-generate a trace ID.
OpenTelemetry requires that
- end-user-programmers Instantiate a trace provider
- Configure that trace provider with an exporter
- Install OpenTelemetry plugins to instrument specific node module(s)
A trace provider is the global “hey, we’re going to instrument stuff” object. An exporter is an object that will send telemetry data to another system where you can view it. An OpenTelemetry plugin will perform the act of instrumenting functions and methods from a NodeJS package.
Step 1: Create our trace provider and configuring it with an exporter
We’ll start by creating our trace provider and configuring it with an exporter. To do this, we’ll need to install
$ npm install @opentelemetry/node
OpenTelemetry auto instrumentation package for NodeJS
The @opentelemetry/node module provides auto-instrumentation for Node.js applications, which automatically identifies frameworks (Express), common protocols (HTTP), databases, and other libraries within your application. This module uses other community-contributed plugins to automatically instrument your application to automatically produce spans and provide end-to-end tracing with just a few lines of code.
OpenTelemetry Plugins
$ npm install @opentelemetry/plugin-http
$ npm install @opentelemetry/plugin-express
The @opentelemetry/plugin-http plugin generates trace data from NodeJS’s underlying HTTP handling APIs that both send, and handle requests. The @opentelemetry/plugin-express plugin generates trace data from requests sent through the express framework.
Step 2: Adding the Trace Provider and the Span Processor
This code creates a trace provider and adds a span processor to it. The trace processor requires an exporter, so we instantiate that as well. Don’t worry too much about the difference between a span processor and an exporter right now — just know that they both are responsible for getting the telemetry data out of your service and into another system. In this case “the system” is your console window.
const { NodeTracerProvider } = require('@opentelemetry/node');
const { ConsoleSpanExporter, SimpleSpanProcessor } = require('@opentelemetry/tracing');

const provider = new NodeTracerProvider();
const consoleExporter = new ConsoleSpanExporter();
const spanProcessor = new SimpleSpanProcessor(consoleExporter);
provider.addSpanProcessor(spanProcessor);
provider.register()
Once we add this code snippet, whenever we reload http://localhost:3001/dashboard, we should get something like this - beautiful things on the console.

Step 3a: Spinning up Zipkin
Let's spin up a Zipkin instance with the Docker Hub Image
$ docker run -d -p 9411:9411 openzipkin/zipkin
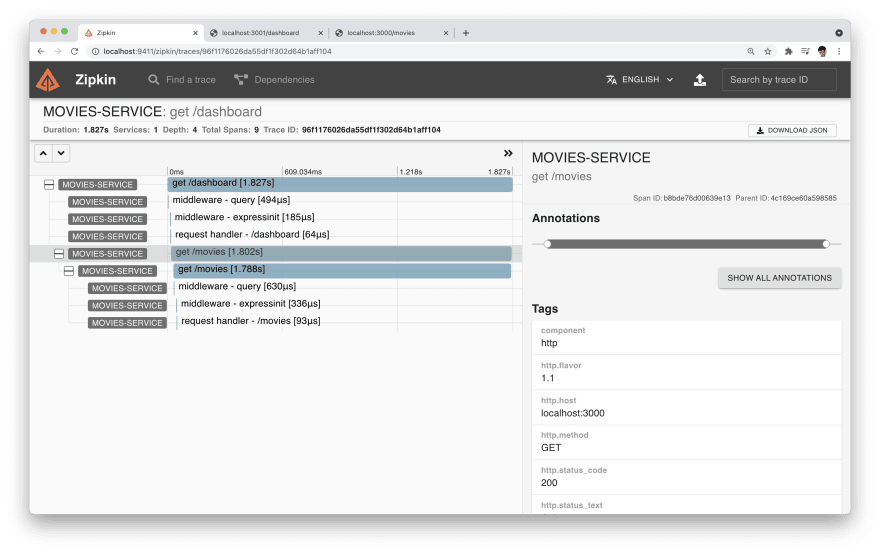
and you’ll have a Zipkin instance up and running. You’ll be able to load it by pointing your web browser to http://localhost:9411. You’ll see something like this

Step 3: Exporting to Zipkin
While it’s neat, spans in a terminal window are a poor way to have visibility into a service. In our code above, the following lines are what added a console exporter to our system. Let's now ship this data to Zipkin.
const { NodeTracerProvider } = require('@opentelemetry/node')
const { ConsoleSpanExporter, SimpleSpanProcessor } = require('@opentelemetry/tracing')
+ const { ZipkinExporter } = require('@opentelemetry/exporter-zipkin')
const provider = new NodeTracerProvider()
const consoleExporter = new ConsoleSpanExporter()
const spanProcessor = new SimpleSpanProcessor(consoleExporter)
provider.addSpanProcessor(spanProcessor)
provider.register()

+ const zipkinExporter = new ZipkinExporter({
+  url: 'http://localhost:9411/api/v2/spans',
+  serviceName: 'movies-service'
})

+ const zipkinProcessor = new SimpleSpanProcessor(zipkinExporter)
+ provider.addSpanProcessor(zipkinProcessor)
Here we’re instantiating a Zipkin exporter, and then adding it to the trace provider. You can have as many different exporters configured as you like — we don’t need to remove our console exporter. With the above in place, and your Zipkin system up and running at localhost:9411, let’s start our application back up and request some URLs.
Step 4: Using the OpenTelemetry Collector to export the data into New Relic
What happens if we want to send the OpenTelemetry data to another backend where you didn't have to manage all of your own telemetry data?
Well, the amazing contributors to OpenTelemetry have come up with a solution to fix this!

The OpenTelemetry Collector is a way for developers to receive, process and export telemetry data to multiple backends. It supports multiple open-source observability data formats like Zipkin, Jaeger, Prometheus, Fluent Bit sending it to one or more open-source or commercial back-ends.
New Relic
New Relic is a platform for you to analyze, store, and use your telemetry data for Free, forever. Sign up now!

Configuring the OpenTelemetry Collector with New Relic
Clone the OpenTelemetry Collector with New Relic Exporter and spin up the docker container, making sure to export the New Relic API key.
export NEW_RELIC_API_KEY=<INSERT-API-KEY-HERE>
docker-compose -f docker-compose.yaml up
? Make sure to change the reporting URL from
http://localhost:9411/api/v2/spanstohttp://localhost:9411/in bothdashboard.jsandmovies.js
const zipkinExporter = new ZipkinExporter({
- url: 'http://localhost:9411/api/v2/spans',
+ url: 'http://localhost:9411',
  serviceName: 'movies-service'
})
Step 5: Look at your ✨ beautiful data ✨
Navigate to the "Explorer" tab on New Relic One.

When you click on the service, you should be able to see some ✨beautiful✨ traces!

Final Thoughts
Instrumenting your app with Open Telemetry makes it easy to figure out what is going wrong when parts of your application is slow, broken, or both. With the collector, you can forward your data anywhere, so you are never locked into a vendor. You can choose to spin up an open source backend, use a proprietary backend like New Relic, or just roll your own backend! Whatever you choose, I wish you well you in journey to instrument EVERYTHING!
This content originally appeared on DEV Community and was authored by Daniel Kim
Daniel Kim | Sciencx (2021-06-24T16:21:26+00:00) Instrumenting Your Node.js Apps with OpenTelemetry. Retrieved from https://www.scien.cx/2021/06/24/instrumenting-your-node-js-apps-with-opentelemetry/
Please log in to upload a file.
There are no updates yet.
Click the Upload button above to add an update.