This content originally appeared on DEV Community and was authored by Harinder Seera ??
As a performance engineer, I work closely with the Ops teams to proactively identify any production performance bottlenecks before they negatively impact the user experience. We employ a variety of monitoring and alerting techniques to help us with this process.
AWS CloudWatch is one of the monitoring tools we utilise. Recently, I was pleasantly surprised to see AWS anomaly detection functionality in CloudWatch. It's a fantastic addition to the CloudWatch features. It brings the capabilities of anomaly detection closer to the other tools like Splunk, AppDynamics, and SumoLogic, to mention a few.
What is an Anomaly?
An anomaly is also called an Outlier. An outlier is a value or point or an object attribute that exhibits an abnormal behaviour in a particular or examined context compared to the rest of the observations.
In a separate post, I will go into more detail on the outliers. For this post, we will focus on CloudWatch.
What is Anomaly detection?
Anomaly detection is the process of discovering values, occurrences, or observations that differ considerably from the majority of the data and raise suspicions. A variety of algorithms are available to assist in anomaly detection. K-nearest neighbour, Local Outlier Factor (LOF), and K-means are a few such examples.
How to set Anomaly detection using CloudWatch?
CloudWatch anomaly detection uses statistical and machine learning algorithms. These algorithms continuously evaluate system and application data, establish normal baselines, and surface anomalies With minimal human participation.
The algorithms are trained using two weeks of metric data. Even if a metric doesn't have a lot of data, you can still enable anomaly detection on it.
In the graph, the projected range of values is shown by a grey band. If the metrics actual value exceeds or drops from this band, it is shown in red. It's algorithms way of saying that this value is a potential anomaly.
To enable anomaly detection, go to the CloudWatch dashboard, pick anomaly detection from the math expressions menu, and then apply calculate band to a specific metric. As shown below.
Below are some of the examples from the AWS documentation. For more information on this topic, refer to this link.
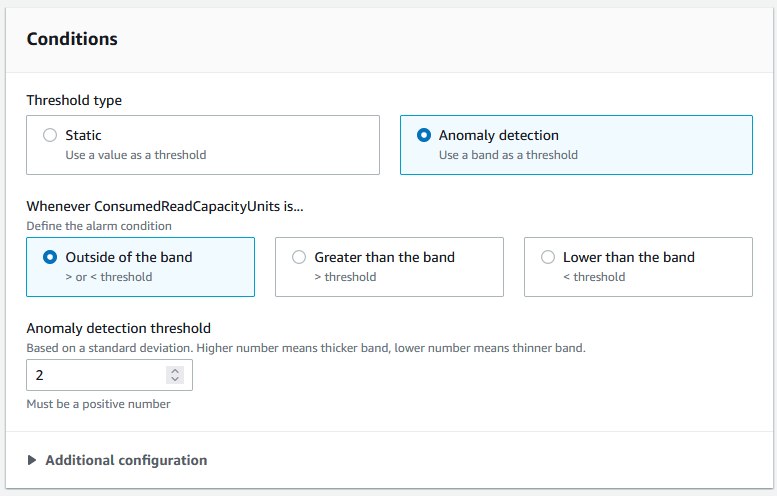
Follow the alert setup method to create an anomalous alert for a metric. Select the "Anomaly detection" condition rather than the "Static" threshold criterion and one of the three alarm conditions. As seen in the illustration below.

You can choose to exclude specific time periods from being used to train the model when you enable anomaly detection on a metric. This way, you may keep deployments and other uncommon occurrences out of model training, resulting in the most accurate model possible.
Once I've integrated it in our test and production environments, I'll report back on my findings.
Note: Using anomaly detection models for alarms incurs charges on your AWS account.
If you want to give it a try, refer this AWS post.
Thanks for reading!
If you enjoyed this article feel free to share on social media ?
Say Hello on: Linkedin | Twitter
Github repo: hseera
This content originally appeared on DEV Community and was authored by Harinder Seera ??
Harinder Seera ?? | Sciencx (2021-06-30T09:52:26+00:00) Anomaly Detection With CloudWatch. Retrieved from https://www.scien.cx/2021/06/30/anomaly-detection-with-cloudwatch/
Please log in to upload a file.
There are no updates yet.
Click the Upload button above to add an update.


