
This content originally appeared on Level Up Coding - Medium and was authored by Nidhin kumar
Overview
In this post, we will see how to upgrade Grafana to the latest version in Ubuntu
Objectives
- What is Grafana
- What’s new in Grafana v8.0
- Database Backup
- Upgrade Grafana
- Updating Plugins
- Restart grafana-server
1. What is Grafana
Grafana is an open-source visualization tool. It does not store data but consumes data sources to create real-time graphs displayed on custom dashboards.
The data source includes InfluxDB, Prometheus, Graphite, CloudWatch, and more.

2. What’s new in Grafana v8.0
Grafana Open source edition contains the following features in v8.0
- Grafana V8.0 alerts
- Library Panels
- Real-time streaming
- Bar chart & State time visualization
- Status history & Histogram visualization
- Time series visualization updates
- Node graph & Pie chart updates
- Panel editor updates
Click here to know more about What’s new in Grafana 8.0

Now let’s begin upgrading Grafana v7.0 to v8.0 in Ubuntu
3. Database Backup
Before upgrading it is good to take a backup of the database as well as the plugins installed
During startup, Grafana will automatically migrate the database schema (if there are changes or new tables). Sometimes it might cause issues if you later want to downgrade
SQLite
Since we are using SQLite as the database for Grafana(default one) we would do the following steps to take a backup
Navigate to /var/lib/grafana/grafana.db and copy the grafana.db to a folder.
If you installed Grafana in a custom location using a binary tar/zip it is usually in grafana_install_dir>/data
MySQL
If you have used MySQL as the database for Grafana then follow the below steps
backup:
> mysqldump -u root -p[root_password] [grafana] > grafana_backup.sql

restore:
> mysql -u root -p grafana < grafana_backup.sql
Postgres
If you have used Postgres as the database for Grafana then follow the below steps for backup
backup:
> pg_dump grafana > grafana_backup

restore:
> psql grafana < grafana_backup

4. Upgrade Grafana
Let’s upgrade Grafana to the latest version
Debian Package
If you have installed Grafana by downloading a Debian package (.deb) then you can execute the same dpkg -i command with the new package which will upgrade your Grafana installation
Go to the download page for the latest download links
wget <debian package url>
sudo apt-get install -y adduser libfontconfig1
sudo dpkg -i grafana_<version>_amd64.deb
Upgrade from the APT repository
If you have installed Grafana from the APT repository, then Grafana will automatically update when you run apt-get upgrade to upgrade all system packages.
sudo apt-get update
sudo apt-get upgrade
Upgrade from binary .tar file
If you downloaded the binary .tar.gz package, then you can just download and extract the new package and overwrite all your existing files. However, this might overwrite your config changes.
It is recommended that you save your custom configuration changes in a file named <grafana_install_dir>/conf/custom.ini. This allows you to upgrade Grafana without risking losing your configuration changes.
Docker
The below snippet is an example of how to update Grafana in Docker but it depends on how you have configured your container
docker pull grafana/grafana
docker stop my-grafana-container
docker rm my-grafana-container
docker run -d --name=my-grafana-container --restart=always -v /var/lib/grafana:/var/lib/grafana grafana/grafana
Windows
If you downloaded the Windows binary package you can just download a newer package and extract it to the same location (and overwrite the existing files). This might overwrite your configuration changes. It is recommended that you save your configuration changes in a file named <grafana_install_dir>/conf/custom.ini as this will make upgrades easier without risking losing your configuration changes.
5. Updating Plugins
Once we upgraded Grafana now we will update the plugins. You can update all plugins using
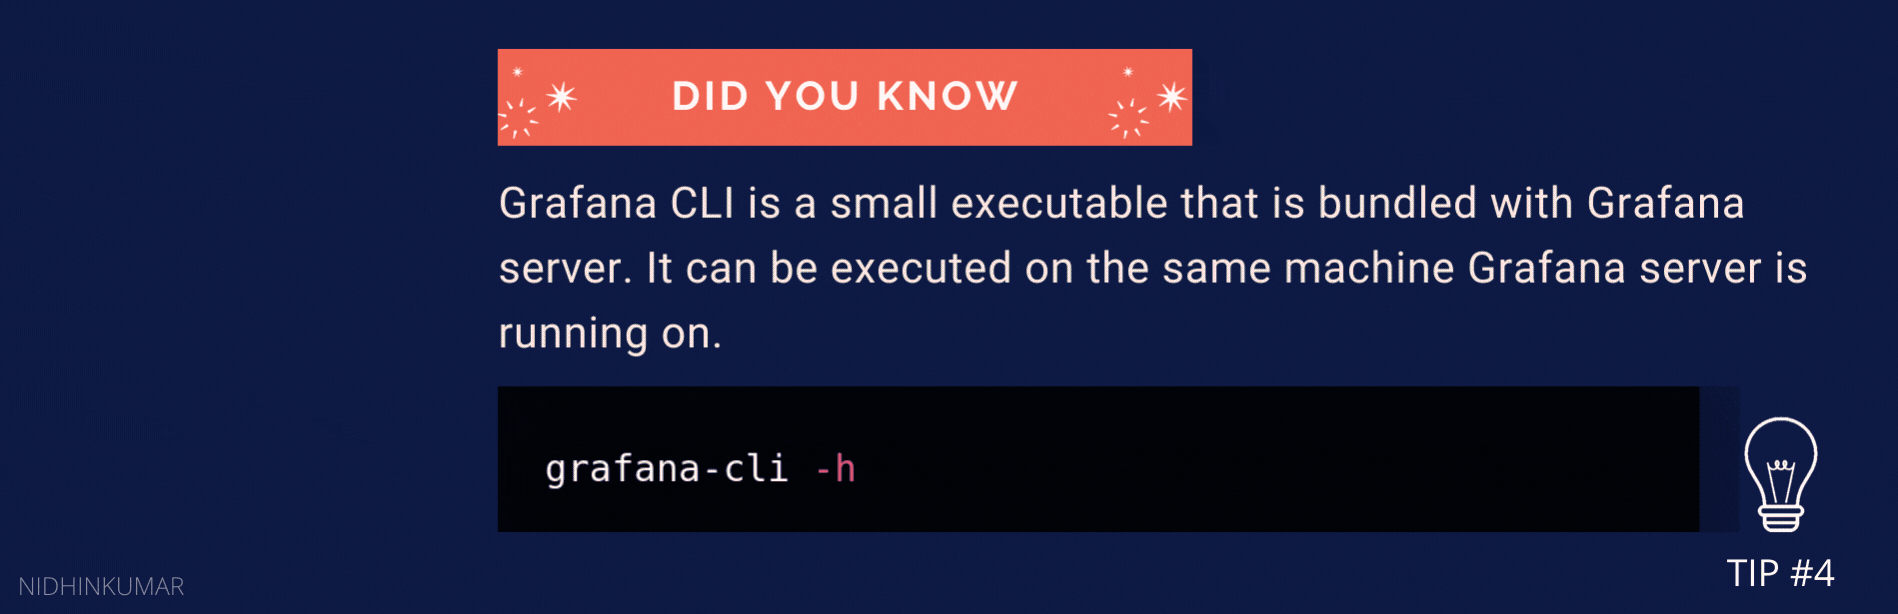
grafana-cli plugins update-all

6. Restart grafana-server
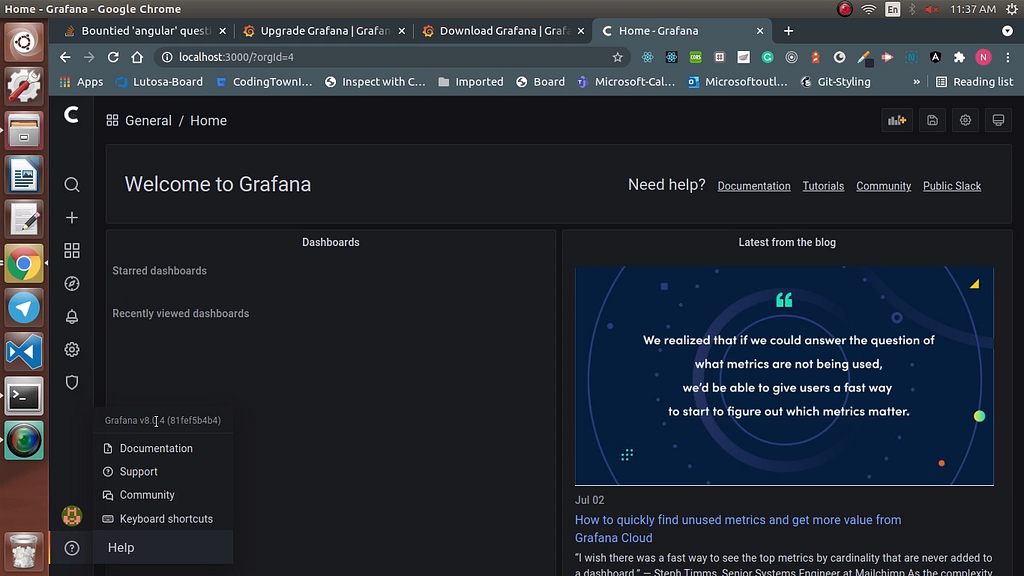
Now we have upgraded our Grafana to v8.0 it’s time to restart the grafana-server using the below command
sudo service grafana-server restart
Now open Grafana in your localhost with the following port number localhost:3000 where you could see the updated version of Grafana like below

Want to more about Grafana here are a few links
Congratulations!
You have learned how to upgrade Grafana from v7.0 to v8.0 in Ubuntu. Now you can play around with the latest features in v8.0.
Catch you up in a new post till then Happy Learning!
Upgrading Grafana from 7.0 to 8.0 in Ubuntu was originally published in Level Up Coding on Medium, where people are continuing the conversation by highlighting and responding to this story.
This content originally appeared on Level Up Coding - Medium and was authored by Nidhin kumar
Nidhin kumar | Sciencx (2021-07-04T04:13:27+00:00) Upgrading Grafana from 7.0 to 8.0 in Ubuntu. Retrieved from https://www.scien.cx/2021/07/04/upgrading-grafana-from-7-0-to-8-0-in-ubuntu/
Please log in to upload a file.
There are no updates yet.
Click the Upload button above to add an update.