This content originally appeared on DEV Community and was authored by Eric P Green
The holy grail of data work is putting data science into production. But without an extensive data engineering background, you might not know how to build a production data system. In this post, I'll show how you can turn a machine learning model into a production data app by laying out the high-level system design of a simple Reddit analytics tool.
Let’s analyze the seriousness of Reddit posts
Reddit is a serious place for serious people, but sometimes subreddits become corrupted by miscreants who spread useless banter. To avoid such unpleasantries, we want to build a web app that can advise us of the seriousness of different subreddits.
For our project, we’ll use machine learning to score the seriousness of every individual Reddit post. We’ll aggregate the scores by subreddit and time, and we’ll expose the insights via an API that we can integrate with a frontend. We want our insights to update in near real-time so we’re reasonably up-to-date with the latest posts.
So we’re clear on what the system should do, here’s the API interface:
-
/subreddit/[name]: Returns a) a subreddit’s posts and their seriousness scores, b) an all-time seriousness score, and c) hourly seriousness scores for the last week -
/subreddits: Returns all subreddits we track and the all-time seriousness score for each
Let’s dive in.
Phase 1: building the data ingestion engine
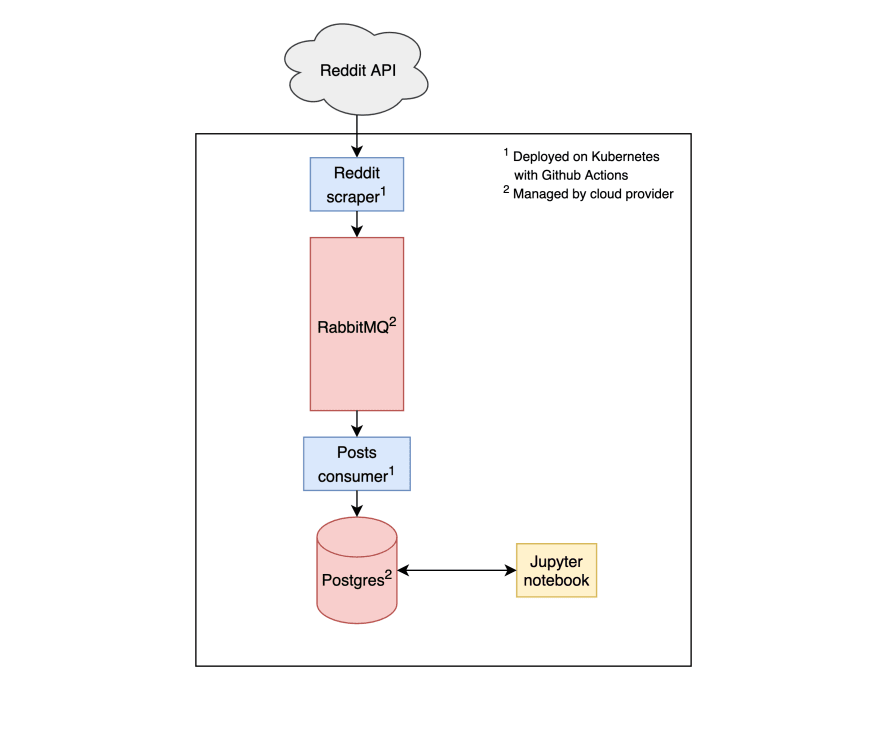
To start, we want to extract posts from Reddit and write it into our own storage system. Our storage system will have two components: a message queue and a database.
- Message queue: We’ll use a message queue to both store and enrich data in real-time. We’ll use RabbitMQ to keep things simple.
- Database: We’ll use a database to permanently store and serve the data. Our API server will get its data from here. We’ll use Postgres, the do-it-all relational data store.
With our storage system in place (in theory), let’s write the first scripts of our data pipeline.
-
Reddit scraper: This script polls the Reddit API every second and writes new posts to a
poststopic in our message queue. -
postsconsumer: This script reads data from thepoststopic and inserts it into our Postgres database.
We need a way to deploy and run our code in production. We like to do that with a CI/CD pipeline and a Kubernetes cluster.
- CI/CD pipeline: On every git commit, we’ll build our code as a Docker container, push it to a container registry, and deploy it to Kubernetes. GitHub Actions makes this easy to set up.
- Kubernetes cluster: Kubernetes is a platform for running containerized code. Kubernetes can also store our database and Reddit credentials, and inject them into our containers.
We’ll use a cloud provider to provision the message queue, database and Kubernetes cluster. We prefer managed services when they’re available, so we won’t deploy the message queue or database directly on Kubernetes.
Here’s a diagram of what our system looks like so far:
Once all this is up and running, we need to validate that the data is flowing. An easy way to do that is to connect to our Postgres database and run a few SQL queries to check that new posts are continually added. When everything looks good, we’re ready to move on.
Phase 2: training the machine learning model
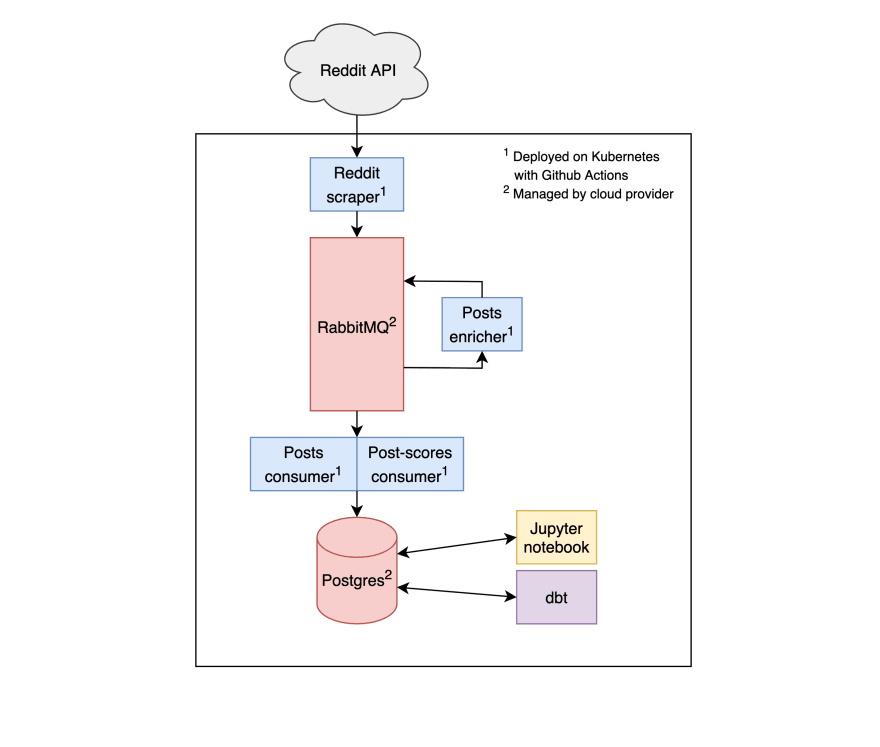
Now that we have the raw data in Postgres, we’re ready to develop our moneymaker, the seriousness scoring model. For this example, we’ll keep things simple and use a Jupyter notebook that pulls historical posts from the Postgres database.
- Jupyter notebook: Inside the notebook, we label some training data, train and assess our model, and save the model to a file. Then our production code will be able to load the file to make inferences.
Note that there are other ways to train a machine learning model. Fancy “MLaaS'' and “MLOps” tools can help you continuously train, monitor and deploy models. If you want to integrate with one of these tools, you’ll likely connect your database to enable training, and you’ll ping an API to make an inference.
Here’s our system augmented with our ML development environment:
Phase 3: applying the model and aggregating the scores
Now it’s time to build the workers that will apply the model to new posts, and write out the resulting seriousness scores. That’s two different scripts:
-
postsenrichment. This script consumes the Redditpoststopic, applies the predictive model, and writes the data back to another topicposts-scores, which will contain post IDs and seriousness scores. -
post-scoresconsumer. This script reads data from theposts-scorestopic and inserts them into (a separate table in) our Postgres database.
Next up, we want to aggregate our results by subreddit and time. We’ll use dbt, which allows us to schedule periodic SQL queries. We’ll schedule two aggregating queries:
-
Roll up new scores: We’ll run this query every five minutes. On every run, it’ll calculate the mean scores of new posts and save the results to a table
subreddit-scores-5minin Postgres. -
Compute total score: This is a heavier query, so we’ll only run it once a day. It will compute each subreddit’s total seriousness score (across all time) and save the results to a table
subreddit-scores-total.
With that, we have all the data that we want for our app available in Postgres. Here’s what the system looks like now:
Phase 4: completing a web app
Our last step is creating the interfaces for accessing our Reddit insights. We need to set up a backend API server and write our frontend code.
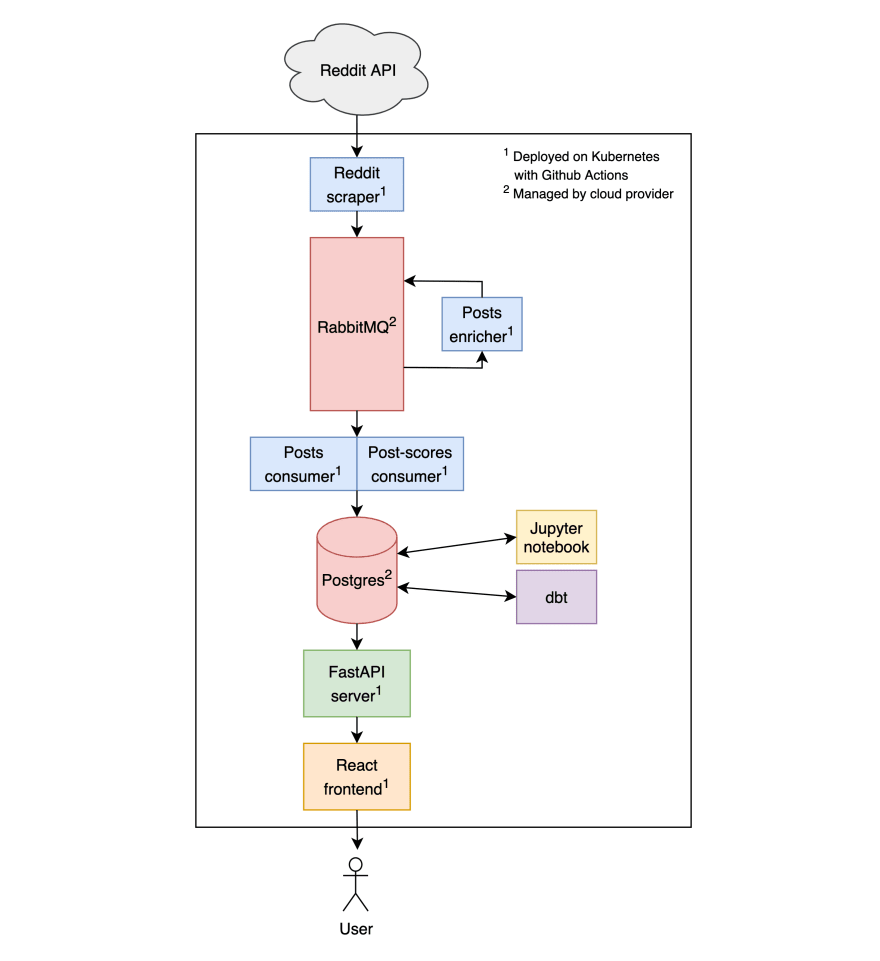
API server. The API server will fetch the insights from Postgres and serve the results to the frontend. It’ll implement the routes we specified in the introduction. We’ll build the API server in Python using the FastAPI framework.
Frontend client. The frontend will contain tables and charts for viewing and searching the insights. We’ll implement it with React and use a fancy charting library like Recharts.
Deploy the API server and frontend code to Kubernetes, and we have ourselves a full stack analytics application! Here’s what the final design looks like:
Reviewing the stack
Our Reddit analytics app is now ready to share with the world (at least on paper). We’ve set up a full stack that spans data ingest, model training, real-time predictions and aggregations, and a frontend to explore the results. It’s also a reasonably future proof setup. We can do more real-time enrichment thanks to the message queue, and we can do more aggregations thanks to dbt.
But the system does have its limitations. For scalability, we’re limited by the throughput of Postgres and RabbitMQ. For latency, we’re limited by the batched nature of dbt. To improve, we could add BigQuery as a data warehouse, use Kafka as our message queue, and add Flink as a real-time stream processor, but these powerful systems also come at the cost of greater complexity.
While there are always different tools you can use for the same job, this data system design is fairly standard. I hope it gives you perspective on what it takes to build a live analytics-centric web application.
This content originally appeared on DEV Community and was authored by Eric P Green
Eric P Green | Sciencx (2021-07-05T18:16:00+00:00) Evolution of a data system. Retrieved from https://www.scien.cx/2021/07/05/evolution-of-a-data-system/
Please log in to upload a file.
There are no updates yet.
Click the Upload button above to add an update.


