This content originally appeared on DEV Community and was authored by Rajitha Gunathilake
Hi everyone,
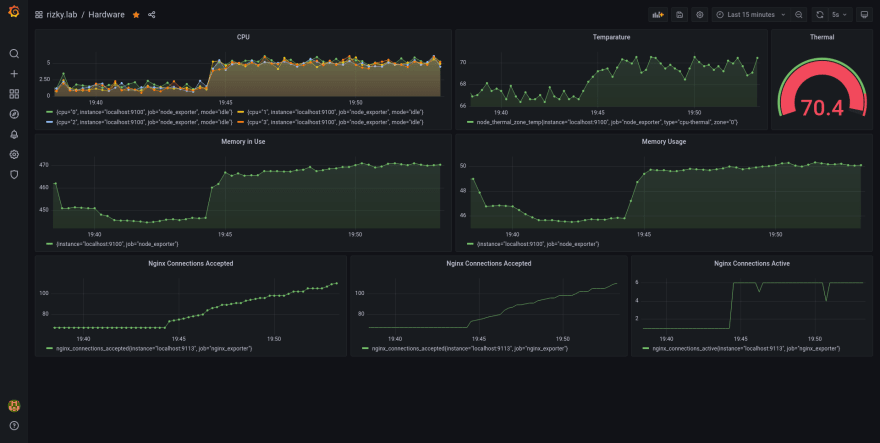
This is a tutorial I am going to walk through how to install and configure an Orange Pi Zero with Prometheus and Grafana for monitoring hardware.
I am using Orange pi zero in this tutorial with AllWinner H2 Quad-core processor.
Let's start by updating the Orange pi.
sudo apt-get update
I first installed downloaded the Prometheus from their github release. because my orangepi is base on arm7 architecture I downloaded the respective archive. here -OL in the curl will redirect if need and save the output file.
curl -OL https://github.com/prometheus/prometheus/releases/download/v2.28.1/prometheus-2.28.1.linux-armv7.tar.gz
after downloading the image extract it to a folder.
tar -xzvf prometheus-2.29.0-rc.0.linux-armv7.tar.gz prometheus-2.29.0-rc.0.linux-armv7/
next, I copied the Prometheus binary to the /usr/local/bin/ because that I generally where your binary files live in.
cd prometheus-2.29.0-rc.0.linux-armv7/
cp prometheus /usr/local/bin/
after all that was set up, I created a service file for systemd to configure Prometheus as a service in /etc/systemd/system/.
this directory is where we write systemd unit files. there are many places among this one but this I a conventional directory that is best suited in this scenario.
sudo nano /etc/systemd/system/prometheus.service
[Unit]
Description=Prometheus monitoring
Wants=network-online.target
After=network-online.target

[Service]
Type=simple
ExecStart=/usr/local/bin/prometheus \
                    --config.file /home/batman/prometheus/prometheus.yml \
                    --web.route-prefix=/ \
                    --web.external-url=http://rizky.lab/prometheus
Restart=always

[Install]
WantedBy=multi-user.target
in this file, I have added the ExecStart path to the Prometheus binary. here I also added some more arguments to configure Prometheus, because I want to run Prometheus behind an Nginx reverse proxy. and also added the config file in path /home/batman/prometheus/prometheus.yml so make sure you have the default prometheus.yml (comes with the tar archive) file in the specified path.
after that is done. I restarted the systemd daemon and then enable the service.
enabling service will make sure that this service will run after a reboot. it might do many other things behind the back but I notice this when I used this service without enabling it.
next stared Prometheus.
sudo systemctl daemon-reload
sudo systemctl enable prometheus
sudo systemctl restart prometheus
sudo systemctl status prometheus
next, we can start installing the node_exporter for orange pi
here also, I looked the same way, searched for the armv7 architecture binary.
just as before download extract and copy it to the /usr/local/bin/ directory.
curl -OL https://github.com/prometheus/node_exporter/releases/download/v1.2.0/node_exporter-1.2.0.linux-armv7.tar.gz
tar -xzvf node_exporter-1.2.0.linux-armv7.tar.gz node_exporter-1.2.0.linux-armv7/
cd node_exporter-1.2.0.linux-armv7/
sudo cp node_exporter  /usr/local/bin/
next, I repeated the same steps for creating the unit file for systemd.
sudo nano /etc/systemd/system/nodeexporter.service
[Unit]
Description=node exporter for node monitoring
Wants=network-online.target
After=network-online.target

[Service]
Type=simple
ExecStart=/usr/local/bin/node_exporter
Restart=always

[Install]
WantedBy=multi-user.target
after setting up the node_exporter , reload systemd daemon and restarted node_exporter.
keep in mind the service will name after the name of the service file. here node_exporter service will be recognized as nodeexporter because I named the unit file nodeexporter.service
sudo systemctl daemon-reload
sudo systemctl enable nodeexporter
sudo systemctl restart nodeexporter
sudo systemctl status nodeexporter
now that we have all in place, next add this nodeexporter to Prometheus as a target. to do that we need to edit the
prometheus.yml file we specified earlier. I appended the following to the prometheus.yml.
- job_name: "node_exporter"

  static_configs:
    - targets: ["localhost:9100"]
after that restart, Prometheus to catch up with new changes. you can see the change at this point if you visit Prometheus via its opened port.
after that, I set up Grafana for the monitoring dashboard.
For Grafana, it's a bit different than the last approach, hence it could be installed with apt.
I pretty much followed they're offcial documentation
wget -q -O - https://packages.grafana.com/gpg.key | sudo apt-key add -
echo "deb https://packages.grafana.com/oss/deb stable main" | sudo tee -a /etc/apt/sources.list.d/grafana.list
sudo apt-get update
sudo apt-get install -y grafana
sudo systemctl demon-reload
sudo systemctl enable grafana-server
sudo systemctl start grafana-server
systemctl status grafana-server
hereafter setting up everything I need to alter come configurations in the grafana.ini file to allow Grafana to access behind a reverse proxy.
this Grafana file lives in /etc/grafana directory by default.
in that configuration we have to set domain , root_url and serve_from_sub_path options.
[server]
# The public facing domain name used to access grafana from a browser
domain = rizky.lab

# The full public facing url you use in browser, used for redirects and emails
# If you use reverse proxy and sub path specify full url (with sub path)
# ;root_url = %(protocol)s://%(domain)s:%(http_port)s/
root_url = %(protocol)s://%(domain)s:%(http_port)s/grafana/

# Serve Grafana from subpath specified in `root_url` setting. By default it is set to `false` for compatibility reasons.
serve_from_sub_path = true
after setting this up, restart Grafana to pick up with the latest changes.
now as the last step configure the Nginx as the reverse proxy to access our all mighty Grafana dashboard.
here I previously configured a site as rizky.lab , so I am editing that to suit the needs, but you can try any way you like.
server {
  listen 80 default_server;
  listen [::]:80 default_server;

  root /var/www/rizky.lab;

  index index.html;

  server_name rizky.lab;

         location /prometheus/ {
                proxy_pass http://localhost:9090/;
        }


        location /grafana/ {
                proxy_pass http://localhost:3000/;
        }

        location / {

                try_files $uri $uri/ =404;
        }

        # Proxy Grafana Live WebSocket connections.
        location /grafana/api/live {
                proxy_http_version 1.1;
                proxy_set_header Upgrade $http_upgrade;
                proxy_set_header Connection "Upgrade";
                proxy_set_header Host $http_host;
                proxy_pass http://localhost:3000/;
        }

}
and after all that, we can access the all mighty Grafana Dashboard, and configure it as you wish.

Thanks for reading till the end ?
Cheers ?
This content originally appeared on DEV Community and was authored by Rajitha Gunathilake
Rajitha Gunathilake | Sciencx (2021-08-06T16:28:36+00:00) Setting up Prometheus and Grafana on Orange Pi Zero. Retrieved from https://www.scien.cx/2021/08/06/setting-up-prometheus-and-grafana-on-orange-pi-zero/
Please log in to upload a file.
There are no updates yet.
Click the Upload button above to add an update.
