
This content originally appeared on Level Up Coding - Medium and was authored by Carmine Scarpitta
You can create a Pie Chart in HTML using a simple CSS function called conic-gradient.
First, we add a <div> element to our HTML page, which acts as a placeholder for our pie chart.
We need to provide a width and a height to the <div> element, which determine the size of our pie chart:
Then, we need to make our pie chart circle-shaped by setting the border-radius value to 50%:
And finally we are ready to populate the pie chart with our data.
As an example, let’s consider the world population data reported at the following link:
https://www.worldometers.info/geography/7-continents/
We want to show the population distribution per continent using our pie chart.
For each continent, we associate an arbitrary color and the population percentage taken from the above link. The data is summarized in the following table:
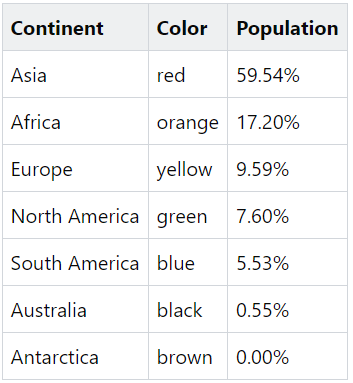
To apply these values to our pie chart, we need to partition it into 7 sectors, a sector for each continent. To create the sectors, we can use the conic-gradient CSS function. Each sector has a color, a start position and a stop position.
For example, Antarctica is represented by the brown color and has 0.00% of the world population. Therefore, we want a brown sector from 0.00% to 0.00%.
Then, we want to plot a black sector representing the Australia, which has 0.55% of the world population. This results in a black sector going from 0.00% to 0.55%.
Similarly, to represent the South America we want a blue sector going from 0.55% to 6.08% (= 0.55% + 5.53%).
And so on.
At the end we will have the following CSS background property:
? That’s all. Now we are able to create a pie chart in CSS.
Build a simple Pie Chart with HTML and CSS was originally published in Level Up Coding on Medium, where people are continuing the conversation by highlighting and responding to this story.
This content originally appeared on Level Up Coding - Medium and was authored by Carmine Scarpitta
Carmine Scarpitta | Sciencx (2021-08-16T15:41:35+00:00) Build a simple Pie Chart with HTML and CSS. Retrieved from https://www.scien.cx/2021/08/16/build-a-simple-pie-chart-with-html-and-css-2/
Please log in to upload a file.
There are no updates yet.
Click the Upload button above to add an update.