This content originally appeared on Bits and Pieces - Medium and was authored by Bhagya Vithana
9 ‘Elements Tab’ Features in Chrome DevTools for Effective Debugging
These features will shape the way you debug frontend applications

The Inspect Element tool is a simple yet powerful built-in feature that comes with Chrome Developer Tools. It’s handy because we can modify a web page’s look or do CSS editing live on the browser.
But, do you know there are way more features in Elements Tab that support debugging? In this article, I’ll walk through some of these features that will make a difference in boosting your productivity.
Quick Look at Inspect Element
I’m sure most of you are familiar with these steps in inspecting elements. However, I’ve listed these steps and highlighted the important areas, which we will explore further.
- Open the site you wish to debug with your Chrome browser.
- If you want to debug an element, right-click on it.
- Click on Inspect. (Clicking the Inspect option from the right-click menu will open the Developer tools for you)
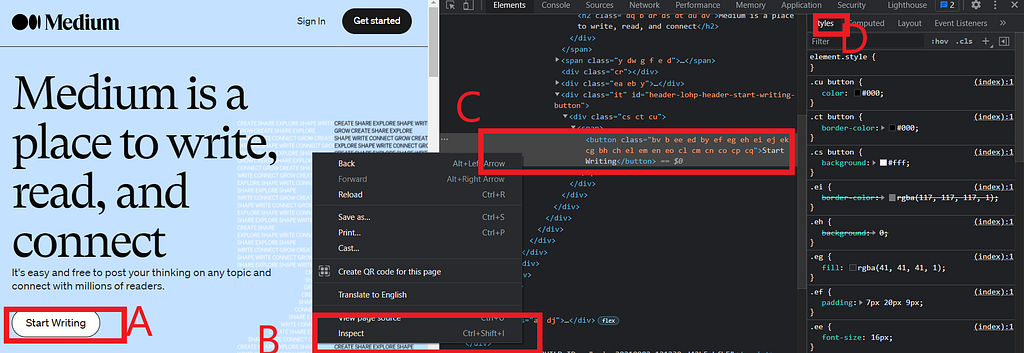
Now you can see the layout clearly:
A — The element you debug B -: Inspect element
C — The element’s HTML
D — The style Tab
Let’s start with the pretty useful features, but we hardly noticed or ignored thinking that they are irrelevant.
1. Break on (DOM change breakpoints)
Do you know that you can add breakpoints to your DOM elements? This feature was there since 2017 but most of us hardly noticed.
It is an alternative way of debugging your code, where you can put a breakpoint for the result and travel back to the code (script) that causes it.
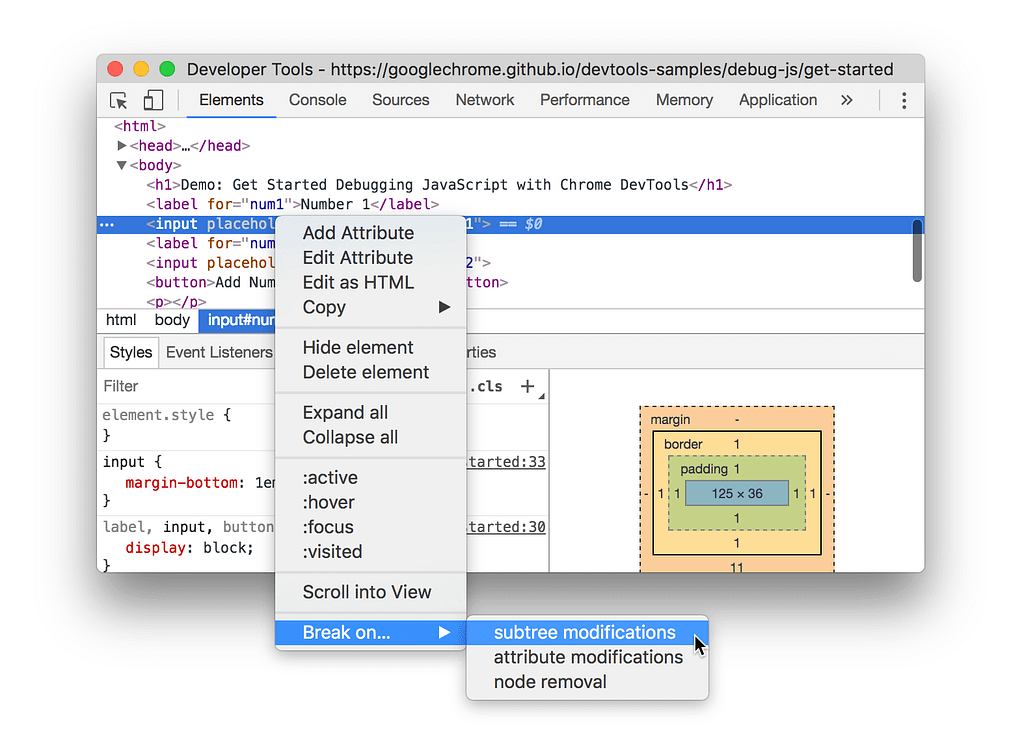
The steps are as follows.
- Press a right-click on the element that you want to set a breakpoint.
- Choose break on option
- Then select among Subtree modifications, Attribute modifications and Node removal.
Types of DOM change breakpoints
- Subtree modifications. Respond to the removal or addition of a child of the selected node, or to the changes of a child’s content.
- Attributes modifications: It’s triggered when an attribute is added or removed on the currently chosen node, or when an attribute value is changed.
- Node Removal: Triggered when the selected node is removed.
2. Store as a global variable
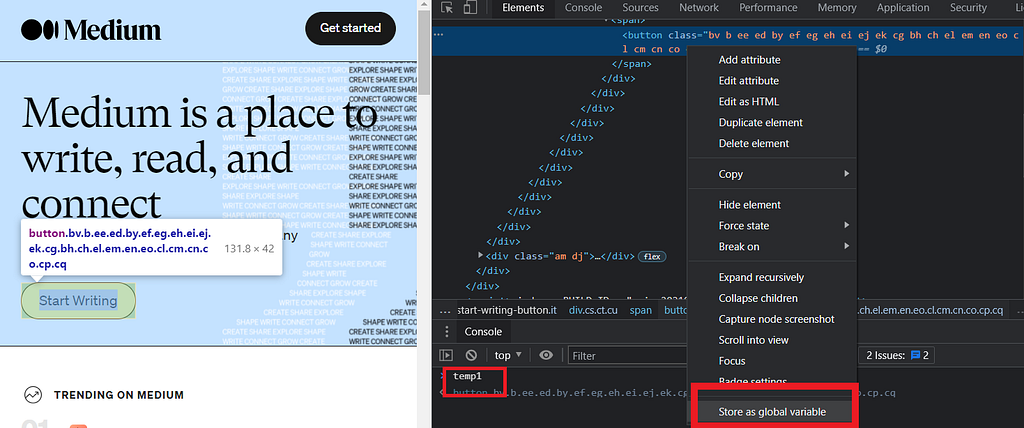
Suppose you want to get a reference to an element live in your browser for debugging purposes. Typically we use DOM methods like document.getElementById or document.getElementsByClassName to get the element node reference. But, do you know it’s just a once click away to do that with the “Store as global variable” feature?
- Use the context menu to select Store as a global variable option when selecting an element in the DOM Tree.
- Input temp1 into the console to see the expression.
3. Scroll into view
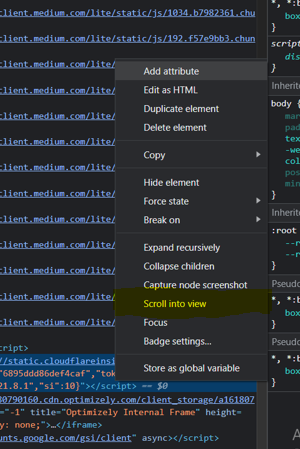
If there is a DOM node that isn’t currently visible in the viewport, you can easily reposition the viewport using this feature.
This is particularly handy when you’ve been debugging for a while and forget where you were or can’t seem to find that element on that page.
Right-click the node and select Scroll into view. Your viewport scrolls back up so that you can see the selected node.
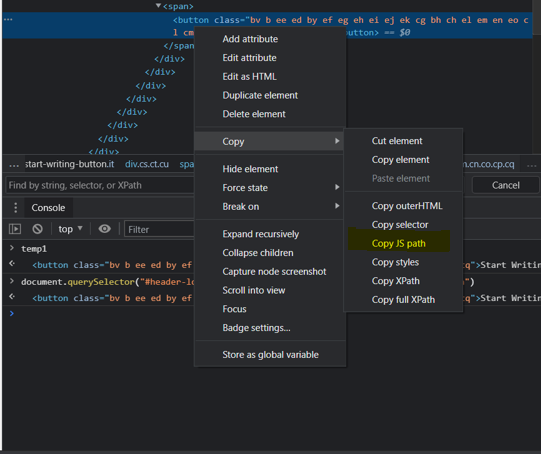
4. Copy JS path
If you’re doing some automation testing, it is necessary to copy the JavaScript path of your node. You can have it by inspecting the Copy JS path option in your context menu(right-click the element you need to save the path)
Then you can paste (Ctrl+V) out the results in the console and see
5. Toggle a pseudo-class (Force state)
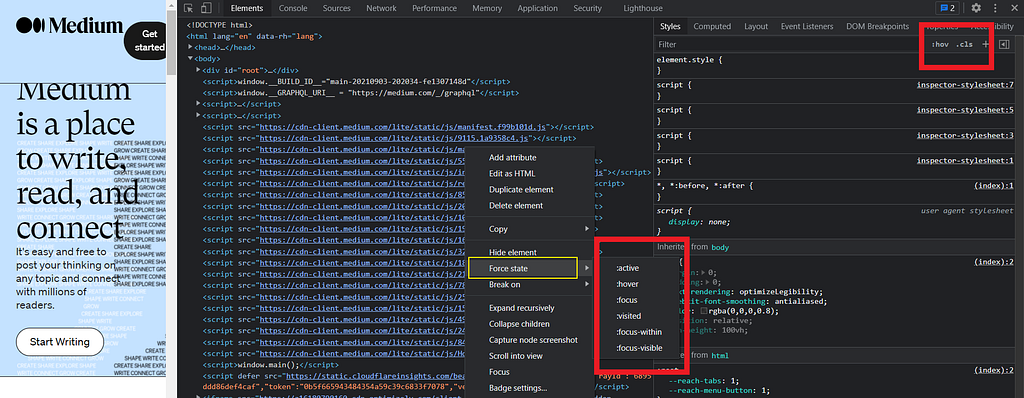
You can also toggle a pseudo-class like :active, :focus, :hover, :visited, :focus-within or focus-visible: to remain in the state.

All you have to do is,
- Go to the Styles tab in the Elements
- select :hov.
- Mark the pseudo-class.
6. The Style Tab
As most of you are aware, it is possible to dynamically update CSS declarations for a selected element by using Style and Compute tabs in the Elements panel.
Here for, selectors that do not match any elements within the document, a fading grayish color will display.
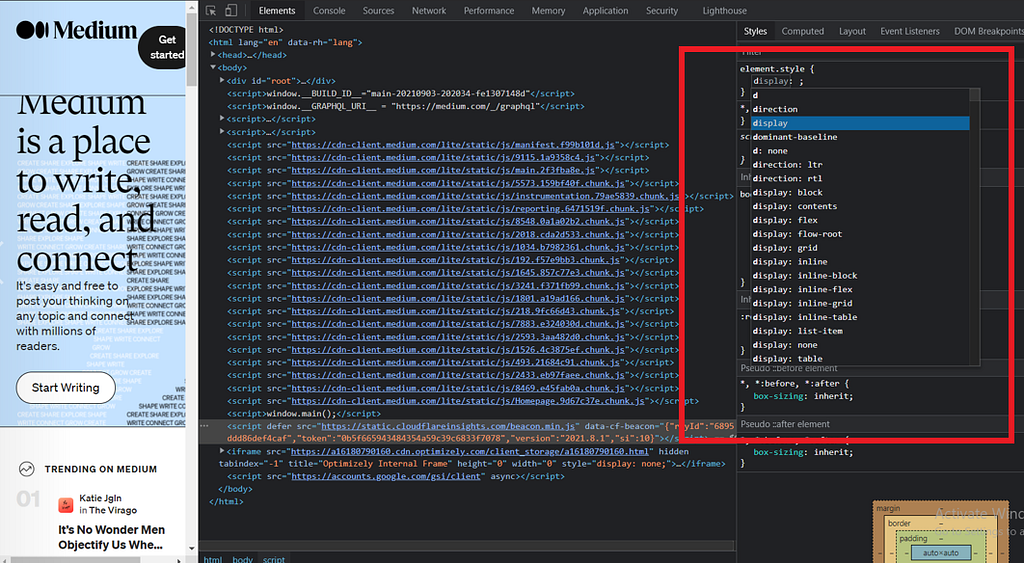
Also it’s possible to add new CSS styles by clicking on the style tab and typing them into the editor. The auto-suggest list will appear as you type, as shown in below image.
Plus, you can change the DOM hierarchy by moving an element from the Elements panel to the target destination too.
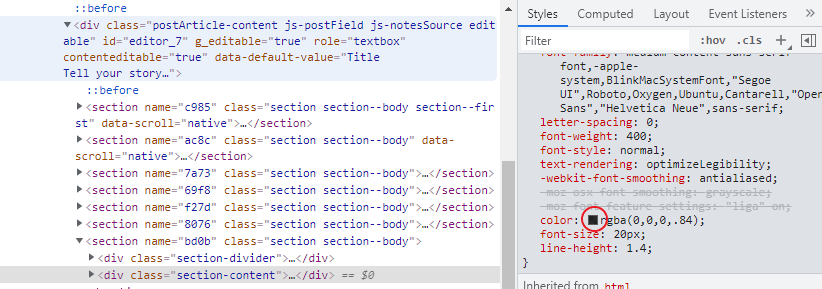
Use the color picker when setting color values to some properties. You can also Shift + Click on the color box to toggle between color formats (RGB, HEX, HSL &, etc.)
7. Hide an element
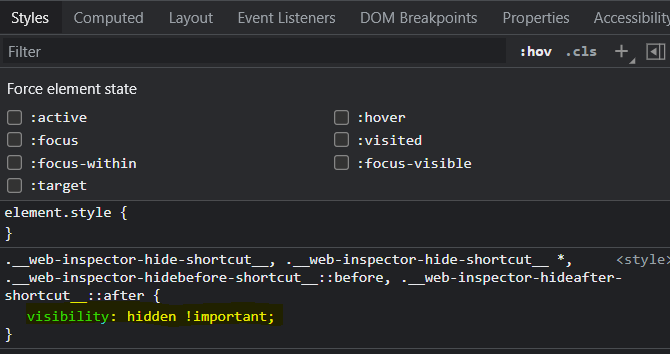
If you want to hide an element, you may do so by right-clicking on the element in the Elements tab and selecting the Hide element option from the context menu.
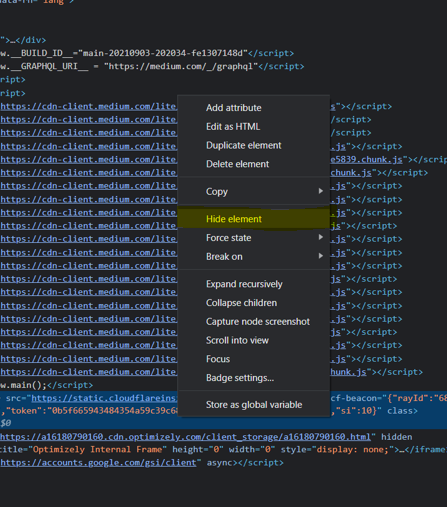
If you’re a fan of shortcuts, pressing the h key will give the same effect.
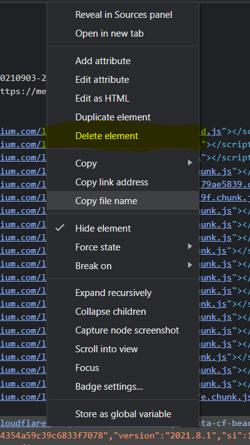
8. Delete an element
You can press a right-click on the element tab and choose the delete element option to remove it from the DOM altogether. If you’re a mac user, you can probably use Control+Z or Command+Z.
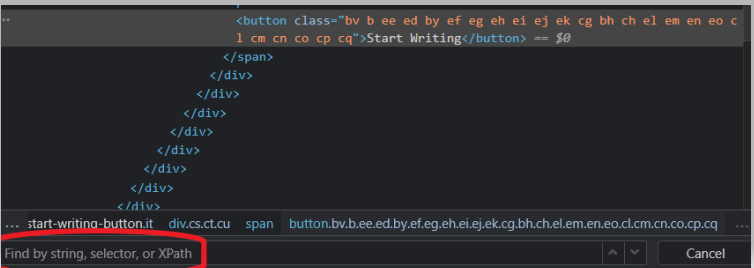
9. Search for an element
Before you start searching, make sure to keep the focus on the element tab. Then simply doing a Ctrl+F, a search bar would appear at the bottom of the DOM Tree. (The search bar supports CSS and XPath selectors also.)
Build better Component Libs and Design Systems
Share components across teams and projects to speed up development and make sure your users experience a consistent design at every touchpoint.
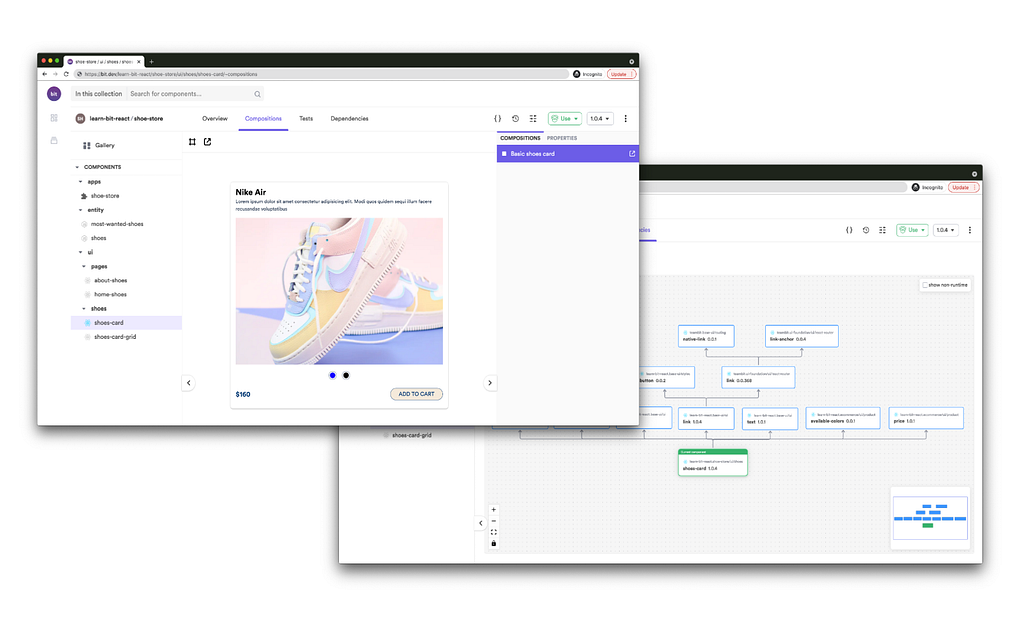
OSS Tools like Bit offer a great dev experience for building, sharing, and adopting components across teams and applications. Create a component hub for free give it a try →
Final Thoughts!!
Chrome DevTools allows you to perform a lot more than just the things you regularly use. And, as we discussed, some features will help to boost your productivity. However, it will require some mind shift change to adopt some of these features how we perform debugging.
Also, it is essential to know them correctly and practice since it is easy to get lost if you don’t know the correct way.
Thank you for reading…!
Learn More
- Building a React Component Library — The Right Way
- 10 Tips to Improve Productivity using Chrome Dev Tools
- Using the Performance Web API with Chrome DevTools
- Debugging CSS Grid like a PRO
9 Element Tab Features in Chrome DevTools for Effective Debugging was originally published in Bits and Pieces on Medium, where people are continuing the conversation by highlighting and responding to this story.
This content originally appeared on Bits and Pieces - Medium and was authored by Bhagya Vithana
Bhagya Vithana | Sciencx (2021-09-09T15:45:11+00:00) 9 Element Tab Features in Chrome DevTools for Effective Debugging. Retrieved from https://www.scien.cx/2021/09/09/9-element-tab-features-in-chrome-devtools-for-effective-debugging/
Please log in to upload a file.
There are no updates yet.
Click the Upload button above to add an update.
