This content originally appeared on DEV Community and was authored by Michael O'Brien
Best practices for DynamoDB have evolved to favor single-table design patterns where one database table serves the entire application and holds multiple different application entities.
This design pattern offers greater performance by reducing the number of requests required to retrieve information and lowers operational overhead. It also greatly simplifies the changing and evolving of your DynamoDB designs by uncoupling the entity key fields and attributes from the physical table structure.
However, managing single-table data and performance can often feel like you are peering at
Assembly Language. Composite keys with prefixed and mapped attribute names are single-table design techniques but they can make just reading a single-table item quite difficult.
What is needed are tools that "understand" the single-table schema and can present and organize your data logically according to your application entities.
To meet this need we've created the DynamoDB Metrics library which calculates and emits detailed single-table performance metrics for DynamoDB.
This post looks at our libraries DynamoDB Metrics, OneTable and the SenseDeep platform that understand your single-table design schema and can create and present detailed metrics to graphically show how your single-table designs are performing.
Single Table Monitoring
So what are the kinds of questions that DynamoDB Metrics can answer?
- Which single-table entity/model is causing the most load and is consuming the most RCU or WCU?
- Which customer tenant is causing the most load and how much should they be billed?
- Which app or function is causing what percentage of load on DynamoDB and is consuming the most RCU or WCU?
- Which queries are the most inefficient (items vs scanned) and by which app or model?
- Which operations are being used the most?
- Which entity is using performing scans or other operations?
These questions and others can be answered by using detailed metrics for DynamoDB that profile performance at an application entity/model level.
DynamoDB Metrics Features
The DynamoDB Metrics library is an NPM module for Node applications that captures and emits detailed DynamoDB metrics. It has the following features:
- Creates detailed CloudWatch metrics for Tables, Indexes, Apps/Functions, Entities and DynamoDB operations.
- Emits metrics using CloudWatch EMF for zero-latency metric creation.
- Supports AWS V2 and V3 SDKs.
- Simple easy integration.
- Very low CPU and memory impact.
- Clean, readable small code base (<400 lines).
- Full TypeScript support.
- No dependencies.
- Optionally integrates with SenseLogs the Serverless Logger for dynamic control of metrics.
- Supported by the free SenseDeep Developer Plan for graphical DynamoDB single-table monitoring.
Metrics Galore
DynamoDB Metrics captures detailed statistics across 5 dimensions:
- Table — Per table metrics
- Tenant — Per tenant metrics
- Source — Per application, module or function identification
- Index — Primary or global secondary index
- Model — Application single-table entity / model name
- Operation — DynamoDB low-level operation: GetItem, PutItem, etc.
You can drill-down to see metrics aggregated by table, tenant, source, index, model or operation. This enables you to pin-point exactly where performance issues may be lurking.
For each of these dimension combinations, DynamoDB Metrics emits the following metrics:
- read — Read capacity units consumed
- write — Write capacity units consumed
- latency — Aggregated request latency in milliseconds
- count — Count of items returned
- scanned — Number of items scanned
- requests — Number of API requests issued
With these metrics, you can see precisely who is consuming read and write capacity, which requests are running long, which requests are inefficient and are scanning the table.
How to get DynamoDB Metrics
There are two ways to get these wonderful single-table metrics for DynamoDB.
The DynamoDB Metrics NPM library can be used by any Node application using DynamoDB. It is configured as AWS SDK middleware and efficiently captures request details with minimal overhead.
Alternatively, you can use the OneTable library that has this support built-in and get all the other benefits of OneTable.
DynamoDB Metrics
To configure DynamoDB Metrics, load the library and pass your DynamoDB client instance to the Metrics constructor. The other parameters tell Metrics how to understand your index and key structure.
import Metrics from 'dynamodb-metrics'
const metrics = new Metrics({
    client: client,
    indexes: {primary: {hash: 'pk', sort: 'sk'}},
    separator: '#',
})
You can read more about how to configure Metrics at DynamoDB Metrics README.
OneTable Support
To enable DynamoDB Metrics using OneTable, just add metrics to your OneTable constructor and specify the name of your application or Lambda function.
const table = new Table({
    metrics: {source: 'acme:launcher'}
})
OneTable uses your defined OneTable schema to understand your key structure.
How to View DynamoDB Single Table Metrics
You can view DynamoDB single-table metrics using CloudWatch or the SenseDeep Serverless Platform.
Viewing via SenseDeep
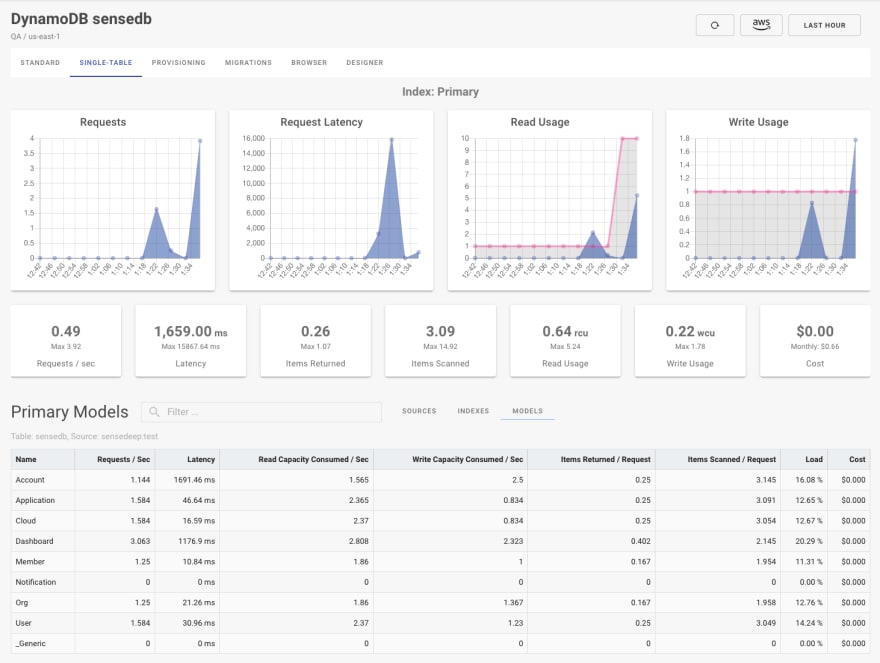
SenseDeep has pre-configured dashboards and graphs to assist in visualizing your DynamoDB metrics. You can drill down and view metrics at the table, tenant, source, index, model or operation dimension level for any desired time period.
It is easy to see which application or function is consuming read/write capacity and how your app data entities are using DynamoDB.
SenseDeep also provides intuitive capacity planning and provisioning assistance.
CloudWatch
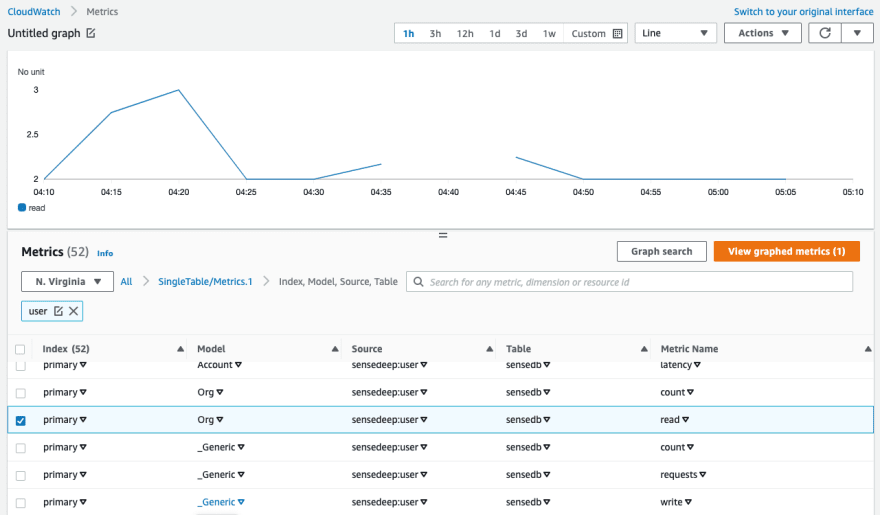
Using CloudWatch Metrics, you can see cards for the DynamoDB Metrics dimension combinations.
The metrics are created under the SingleTable/Metrics.1 namespace. Clicking on a card provides a list of dimension combinations to graph.
Under the Hood
The DynamoDB Metrics library emits metrics using the CloudWatch EMF log-based metrics format. This permits zero-latency creation of metrics without impacting the performance of your Lambdas. EMF allows metrics to be emitted without blocking as would be the case with a normal blocking API.
DynamoDB Metrics will only emit metrics for dimension combinations that are active. If you have many application entities and indexes, you may end up with a large number of metrics. If your site uses all these dimensions actively, your CloudWatch Metric costs may be high. You will be charged by AWS CloudWatch for the total number of metrics that are active each hour at the rate of $0.30 cents per hour.
If your CloudWatch costs are too high, you can minimize your charges by reducing the number of dimensions. The dimensions emitted can be modified via the dimensions constructor property. Alternatively, you can dynamically enable and disable metrics via the LOG_FILTER parameter.
DynamoDB Metrics are buffered and aggregated to minimize the load on your system. If a Lambda function is reclaimed by AWS Lambda, there may be a few metric requests that are not emitted before the function is reclaimed. This should be a very small percentage and should not significantly impact the quality of the metrics. You can control this buffering via the Metrics constructor.
Summary
Gaining insight into single-table design patterns is the new frontier. Previously, single-table designs with DynamoDB has been a black box and it has been difficult to peer inside and see how the components of your design are operating.
DynamoDB Metrics provides an easy way to instrument your code and gain these insights. SenseDeep provides a free developer plan so you can view and analyze these metrics with graphical dashboards.
More?
Download DynamoDB Metrics from NPM at DynamoDB Metrics
For the most elegant way to create single-table designs, consider OneTable.
And you can get a free developer license for SenseDeep at SenseDeep App or learn more at https://www.sensedeep.com.
You may also like to read:
About SenseDeep
SenseDeep is an observability platform for AWS developers to accelerate the delivery and maintenance of serverless applications.
SenseDeep helps developers through the entire lifecycle to create observable, reliable and maintainable apps via an integrated serverless developer studio that includes deep insights into how your apps are performing.
To try SenseDeep, navigate your browser to: https://app.sensedeep.com.
To learn more about SenseDeep please see: https://www.sensedeep.com/product.
Please let us know what you think, we thrive on feedback. dev@sensedeep.com.
Links
This content originally appeared on DEV Community and was authored by Michael O'Brien
Michael O'Brien | Sciencx (2021-09-16T07:54:03+00:00) Understanding your DynamoDB Single Table Performance. Retrieved from https://www.scien.cx/2021/09/16/understanding-your-dynamodb-single-table-performance/
Please log in to upload a file.
There are no updates yet.
Click the Upload button above to add an update.


