This content originally appeared on DEV Community and was authored by Ankit Anand ✨
Choosing the right distributed tracing tool is critical. How do you know which is the right one for you? Here are the top 11 distributed tracing tools that can solve your monitoring and observability needs.
What is a distributed tracing tool?
A distributed tracing tool enables you to track user requests across multiple servers and services in a microservice architecture. It gives you a central overview of how user requests are performing in different services.
Distributed tracing tools have become a critical component in a distributed and microservices-based architecture.
So why is distributed software so popular?
There are three major reasons for the popularity of distributed software: scalability, reliability, and maintainability.
But it also comes with its own challenges. Distributed software becomes complex with scale, and no single team can fully comprehend how all services interact. Although engineering teams own single services, they become implicitly responsible for many services.
A single user request can travel through hundreds or thousands of microservices. So to quickly identify where things are going wrong, you need a central overview of how requests are performing across services.
Distributed tracing tools capture user requests as they travel through every service and measure things like latency.
A great distributed tracing tool can improve your team's response to performance issues, thereby improving the end-user experience.
Here's the list of the top 11 distributed tracing tools we will be looking at in this article:
Before we deep dive into each of these distributed tracing tools, let's take a short detour to understand distributed tracing.
What is distributed tracing?
In the world of microservices, a user request travels through hundreds of services before serving a user what they need. To make a business scalable, engineering teams are responsible for particular services with no insight into how the system performs as a whole. And that's where distributed tracing comes into the picture.
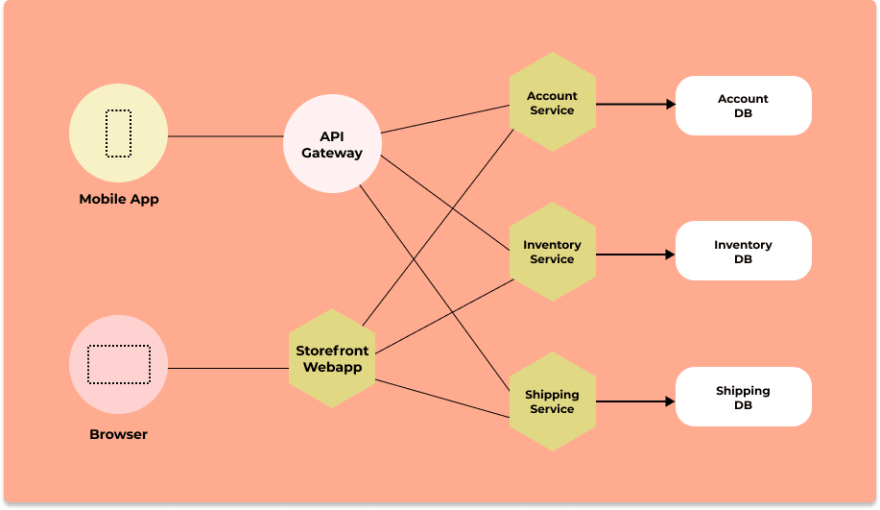 Microservice architecture of a fictional e-commerce application
Distributed tracing gives you insight into how a particular service is performing as part of the whole in a distributed software system. There are two essential concepts involved in distributed tracing: Spans and trace context.
User requests are broken down into spans.
What are spans?
Spans represent a single operation within a trace. Thus, it represents work done by a single service which can be broken down further depending on the use case.
A trace context is passed along when requests travel between services, which tracks a user request across services. Thus, you can see how a user request performs across services and identify what exactly needs your attention without manually shifting through multiple dashboards.
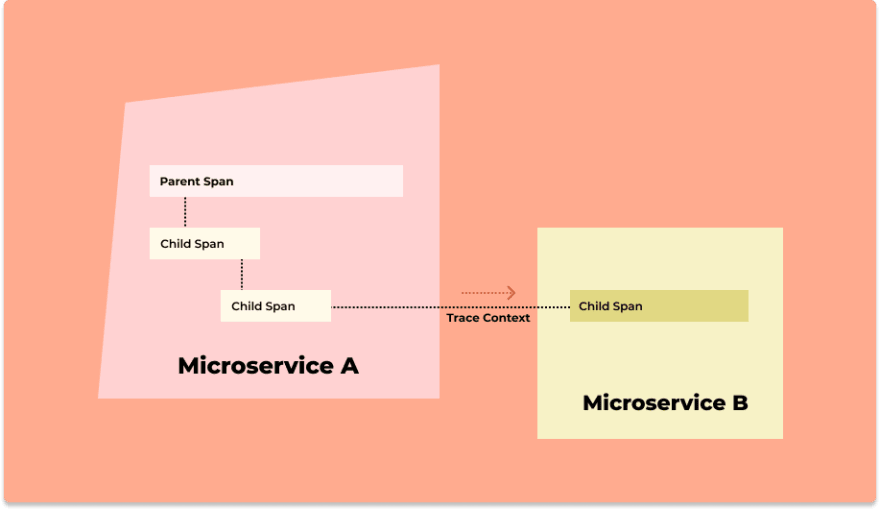 A trace context is passed when user requests pass from one service to another
Below is a snapshot from SigNoz dashboard showing spans from a request as rectangular blocks.
 Spans representing logical operations within a trace as rectangular blocks (Source: SigNoz dashboard)
Top 11 distributed tracing tools
Now let's explore the top 11 distributed tracing tools in 2021.
SigNoz
SigNoz is a full-stack open-source APM and observability tool. It captures both metrics and traces with log management currently in the product roadmap. Logs, metrics, and traces are considered to be the three pillars of observability in modern-day distributed systems.
SigNoz provides a unified UI for metrics and traces so that there is no need to switch between different tools like Jaeger and Prometheus.
Using SigNoz, you can track things like:
- User requests per second
- 50th, 90th, and 99th percentile latencies of microservices in your application
- Error rate of requests to your services
- Slow endpoints in your application
- User requests across different microservices using distributed tracing
An open-source tool with the capabilities of SaaS vendors, SigNoz is a great choice for a distributed tracing tool.
 Architecture of SigNoz with ClickHouse as storage backend and OpenTelemetry for code instrumentatiion
SigNoz uses OpenTelemetry for code instrumentation. OpenTelemetry provides vendor-agnostic instrumentation libraries and is quietly becoming the world standard for generating and managing telemetry data.
 SigNoz UI showing application overview metrics like RPS, 50th/90th/99th Percentile latencies, and Error Rate
You can also use flamegraphs to visualize spans from your trace data. All of this comes out of the box with SigNoz.
 Flamegraphs showing exact duration taken by each spans - a concept of distributed tracing
Gantt charts make it easy to visualize your services and events in a parent-child relationship tree. You can easily figure out which events are causing latency in a request call.
 Gantt charts on SigNoz dashboard to visualize your spans in a parent-child relationship
Jaeger
Jaeger is an open-source APM tool developed at Uber, later donated to Cloud Native Computing Foundation(CNCF). Inspired by Google's Dapper, Jaeger is a distributed tracing system.
It is used for monitoring and troubleshooting microservices-based distributed systems. Some of its key features include:
- Distributed context propagation
- Distributed transaction monitoring
- Root cause analysis
- Service dependency analysis
- Performance / latency optimization
Jaeger supports two popular open-source NoSQL databases as trace storage backends: Cassandra and Elasticsearch. Jaeger's UI can be used to see individual traces. You can also filter the traces based on service, duration, and tags.
 Jaeger UI showing services and corresponding traces
Zipkin
Zipkin is an open-source APM tool used for distributed tracing. Zipkin captures timing data need to troubleshoot latency problems in service architectures.
Zipikin was initially developed at Twitter and drew inspiration from Google's Dapper. Unique identifiers called Trace ID are attached to each request which then identifies that request across services.
Zipkin's architecture includes:
- Reporters to send data to Zipkin
- Collectors which persist trace data to storage
- API to query data
- UI
alt="Zipkin architecture"
height={500}
src="/img/blog/2021/09/zipkin_architecture-min.jpg"
title="Zipkin architecture (Source: Zipkin website)"
width={700}
/>
Zipkin's in-built UI is limited, and you can use Grafana or Kibana from the ELK stack for better analytics and visualizations.
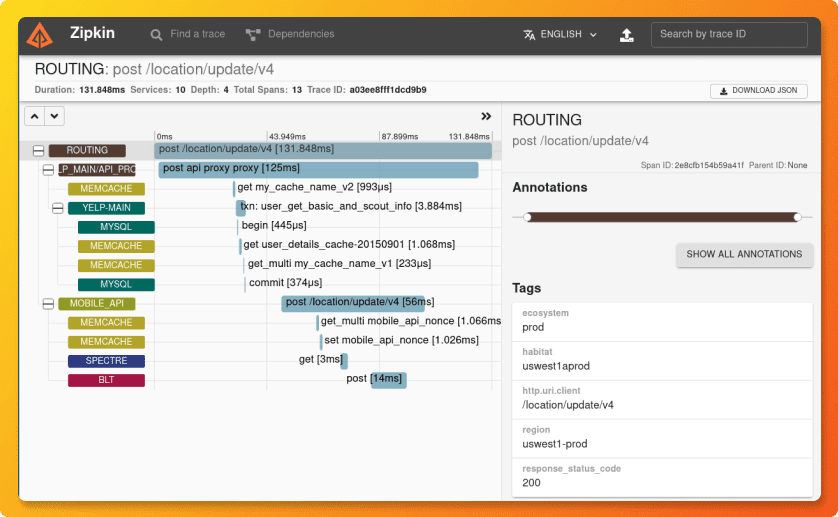 Zipkin UI (Source: Zipkin's GitHub repo)
It also includes a dependency diagram that shows how many user requests went through each service. It can help you to identify error paths and calls to deprecated services.
 Zipkin dependency diagram (Source: GitHub repo)
Dynatrace
Dynatrace is an extensive SaaS enterprise tool targeting a broad spectrum of monitoring needs of large-scale enterprises. For distributed tracing, it provides a technology called Purepath, which combines distributed tracing with code-level insights. When a user initiates a transaction with the application, PurePath gives the transaction a unique ID.
Some of the key features provided by the Dynatrace distributed tracing tool includes:
- Automatic injection and collection of data
- Code-level visibility across all application tiers for web and mobile apps together
- Always-on code profiling and diagnostics tools for application analysis
 Distributed tracing by PurePath technology (Source: Dynatrace website)
 Code-level insights shown on Dynatrace dashboard (Source: Dynatrace website)
New Relic
New Relic is one of the oldest companies in the application performance monitoring domain. It offers multiple solutions to enterprises for performance monitoring. For distributed tracing, it offers New Relic Edge, which can observe 100% of an application's traces.
Some of the key features of the New Relic distributed tracing tool includes:
- Distributed tracing and sampling options for a wide range of technology stack
- Support for open-source tracing tools and standards like OpenTelemetry
- Correlation of tracing data with other aspects of application infrastructure and user monitoring
- Fully managed cloud-native experience with on-demand scalability
 New Relic distributed tracing dashboard (Source: New Relic website)
Honeycomb
Honeycomb is a full-stack cloud-based observability tool with support for events, logs, and traces. Honeycomb provides an easy-to-use distributed tracing solution.
Some of the key features of the Honeycomb distributed tracing tool includes:
- Quickly diagnose bottlenecks and optimize performance with a waterfall view to understand how your system is processing service requests
- Full-text search over trace spans and toggle to collapse and expand sections of trace waterfalls
- Provides Honeycomb beelines to automatically define key pieces of trace data like serviceName, name, timestamp, duration, traceID, etc.
 Honeycomb distributed tracing dashboard (Source: Honeycomb website)
Lightstep
Lightstep is a distributed tracing tool that provides complete visibility to distributed systems based on microservices and multi-cloud environment. It uses open-source friendly data ingestion methods and is built to support applications of any scale.
Some of the key features of the Lightstep distributed tracing tool includes:
- Move seamlessly from a high-level view of dependencies to specific services, operations, traces, or any other signals contributing to issues in production
- Provides full-context root cause analysis with exact logs, metrics, and traces to simplify and solve complex investigations
- Auto-instrumentation libraries powered by OpenTelemetry
 Lighstep distributed tracing dashboard (Source: thenewstack.io)
Instana
Instana is a distributed tracing tool aimed at microservice applications. The Instana platform offers website monitoring, cloud & infrastructure monitoring, observability platform apart from distributed tracing of microservice applications.
Some of the key features of the Instana distributed tracing tool includes:
- A single, lightweight agent per host to continually discover and monitor all components of the technology stack
- Dependency Map to continuously model application services and infrastructure
- Enriched trace data with information about the underlying service, application, and system infrastructure
- Root cause analysis with a correlated sequence of events and issues identifying the exact source of the problem
 Instana distributed tracing dashboard (Source: Instana website)
DataDog
DataDog is an enterprise APM tool that provides monitoring products ranging from infrastructure monitoring, log management, network monitoring to security monitoring. Its application performance monitoring tool has distributed tracing capabilities.
Some of the key features of DataDog APM, which provides distributed tracing capabilities, includes:
- Out of box performance dashboards for web services, queues, and databases to monitor requests, errors, and latency
- Correlation of distributed tracing to browser sessions, logs, profiles, network, processes, and infrastructure metrics
- Can ingest 50 traces per second per APM host
- Service maps to understand service dependencies
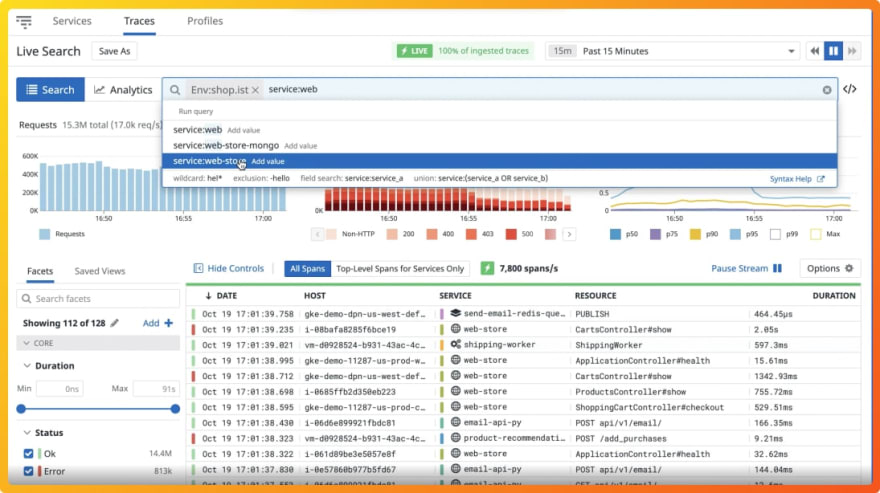 DataDog distributed tracing dashboard (Source: DataDog website)
Elastic APM
Elastic APM is an Application Performance Monitoring system built on the Elastic Stack - ElasticSearch, Logstash, and Kibana. It consists of four components:
- Elasticsearch - For data storage and indexing
- Kibana - For analyzing and visualizing the data
- APM agents - Collects the data to send to the APM server
- APM server - Receives data from APM agents and process it for storing in Elasticsearch

Splunk
Splunk provides a distributed tracing tool that can ingest all application data for a high-fidelity analysis. It stores all trace data in Splunk Cloud's offering.
Some of the key features of the Splunk distributed tracing tool includes:
- No sample full fidelity trace data ingestion With Splunk, you can capture all trace data to ensure your cloud-native application work the way it is supposed to.
- Full-stack observability Splunk APM provides a seamless correlation between infrastructure metrics and application performance metrics.
- AI-Driven troubleshooting Splunk APM provides uses an AI-driven approach to identify error-prone microservices.
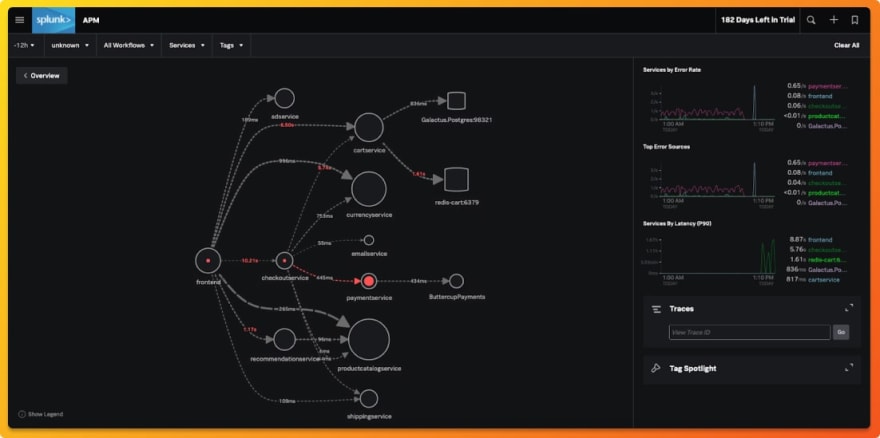 Splunk distributed tracing dashboard (Source: DataDog website)
How to choose the right distributed tracing tool?
Tracing user requests is now critical for maintaining an exemplary user experience. Yes, distributed tracing directly impacts end-user experience as it gives your teams the right insights in the right amount of time to act on issues affecting application performance.
In our view, distributed tracing tools should be developer first tools. As developers directly utilize these tools in critical situations, the codebase of the tools should be open-source. Open-source is the future of all software tools.
Transparency and collaboration are some key benefits of open-source software tools. Developers want to see the code first hand, and if there are issues they want to address, they prefer to reach out to an active developer community than a customer support team.
At the same time, most open-source tools don't provide the same user experience as provided by SaaS vendors. But it doesn't have to be that way. With that objective, we created SigNoz.
SigNoz is a full-stack open-source application performance monitoring and observability tool. It provides a unified UI for both metrics and traces. Log management is also in the product roadmap and will be launched seen.
You can check out SigNoz's GitHub repo here ?
This content originally appeared on DEV Community and was authored by Ankit Anand ✨
Ankit Anand ✨ | Sciencx (2021-09-21T13:12:24+00:00) Top 11 distributed tracing tools in 2021. Retrieved from https://www.scien.cx/2021/09/21/top-11-distributed-tracing-tools-in-2021/
Please log in to upload a file.
There are no updates yet.
Click the Upload button above to add an update.

