This content originally appeared on Stefan Judis Web Development and was authored by Stefan Judis
I just had a look at the current Chrome DevTools experiments and enabled three handy new features. Let's have a look!
First, how do you enable Chrome experiments?
You can either hit the little gear icons in the top-right corner and navigate to "Experiments". As a heavy keyboard user, I preview the shortcut way: open the command palette with CMD + Shift + p and go directly to the experiments menu.
Look at all these possibly upcoming Chrome DevTools features and play around with them. That's why they're there!
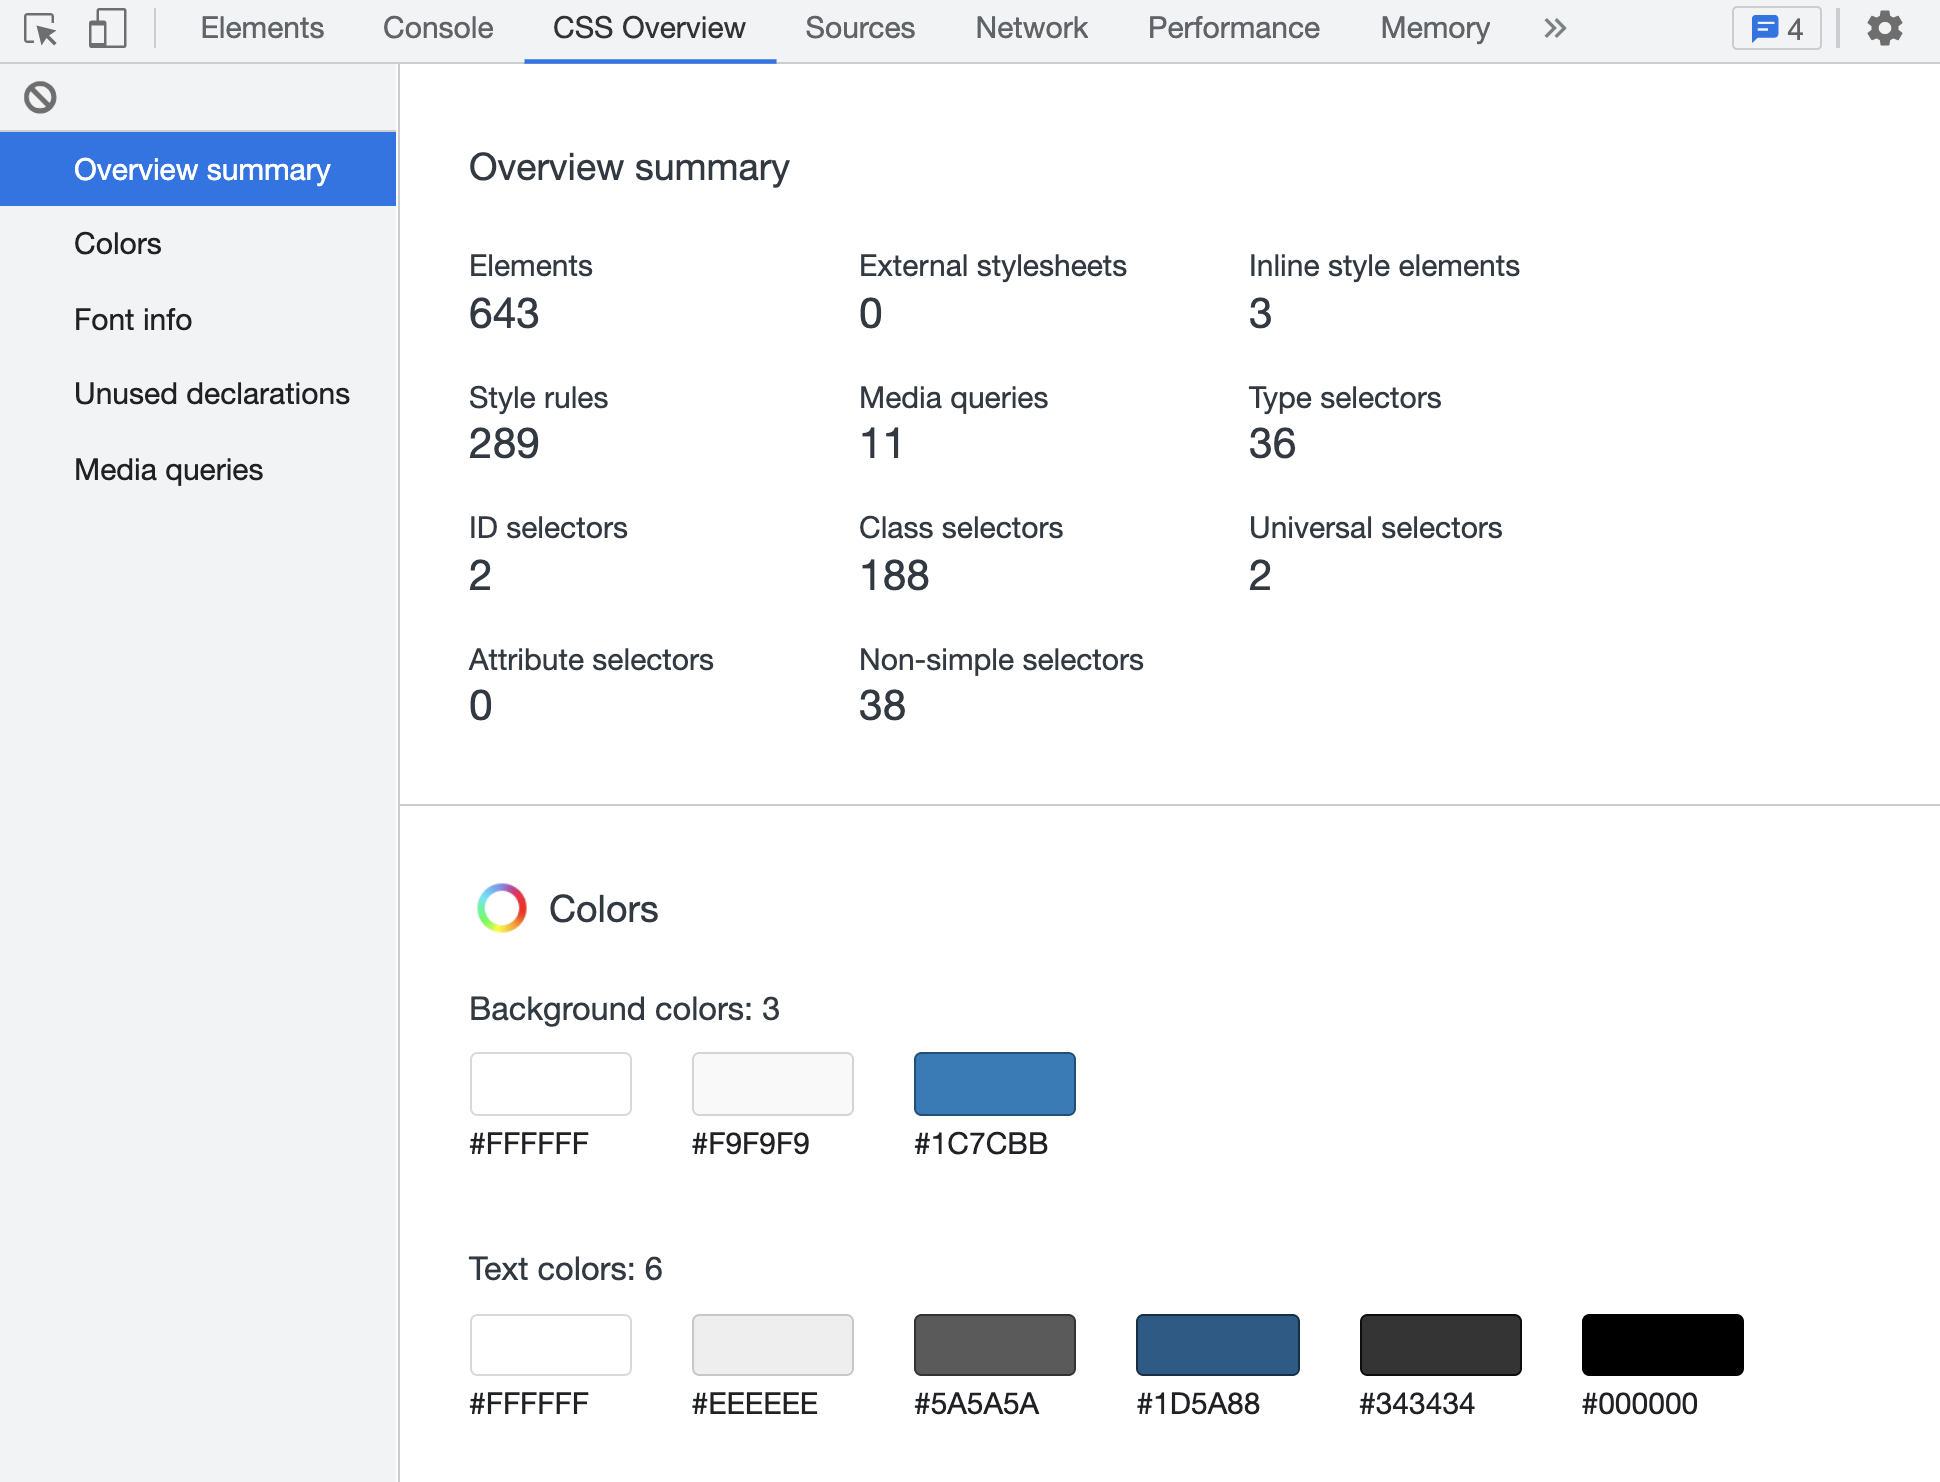
There are many CSS analysis tools out there, but having them right in your developer tools is super handy. The CSS overview lists defined colors and media queries, used fonts and useless CSS declarations. It's time to clean up your CSS!
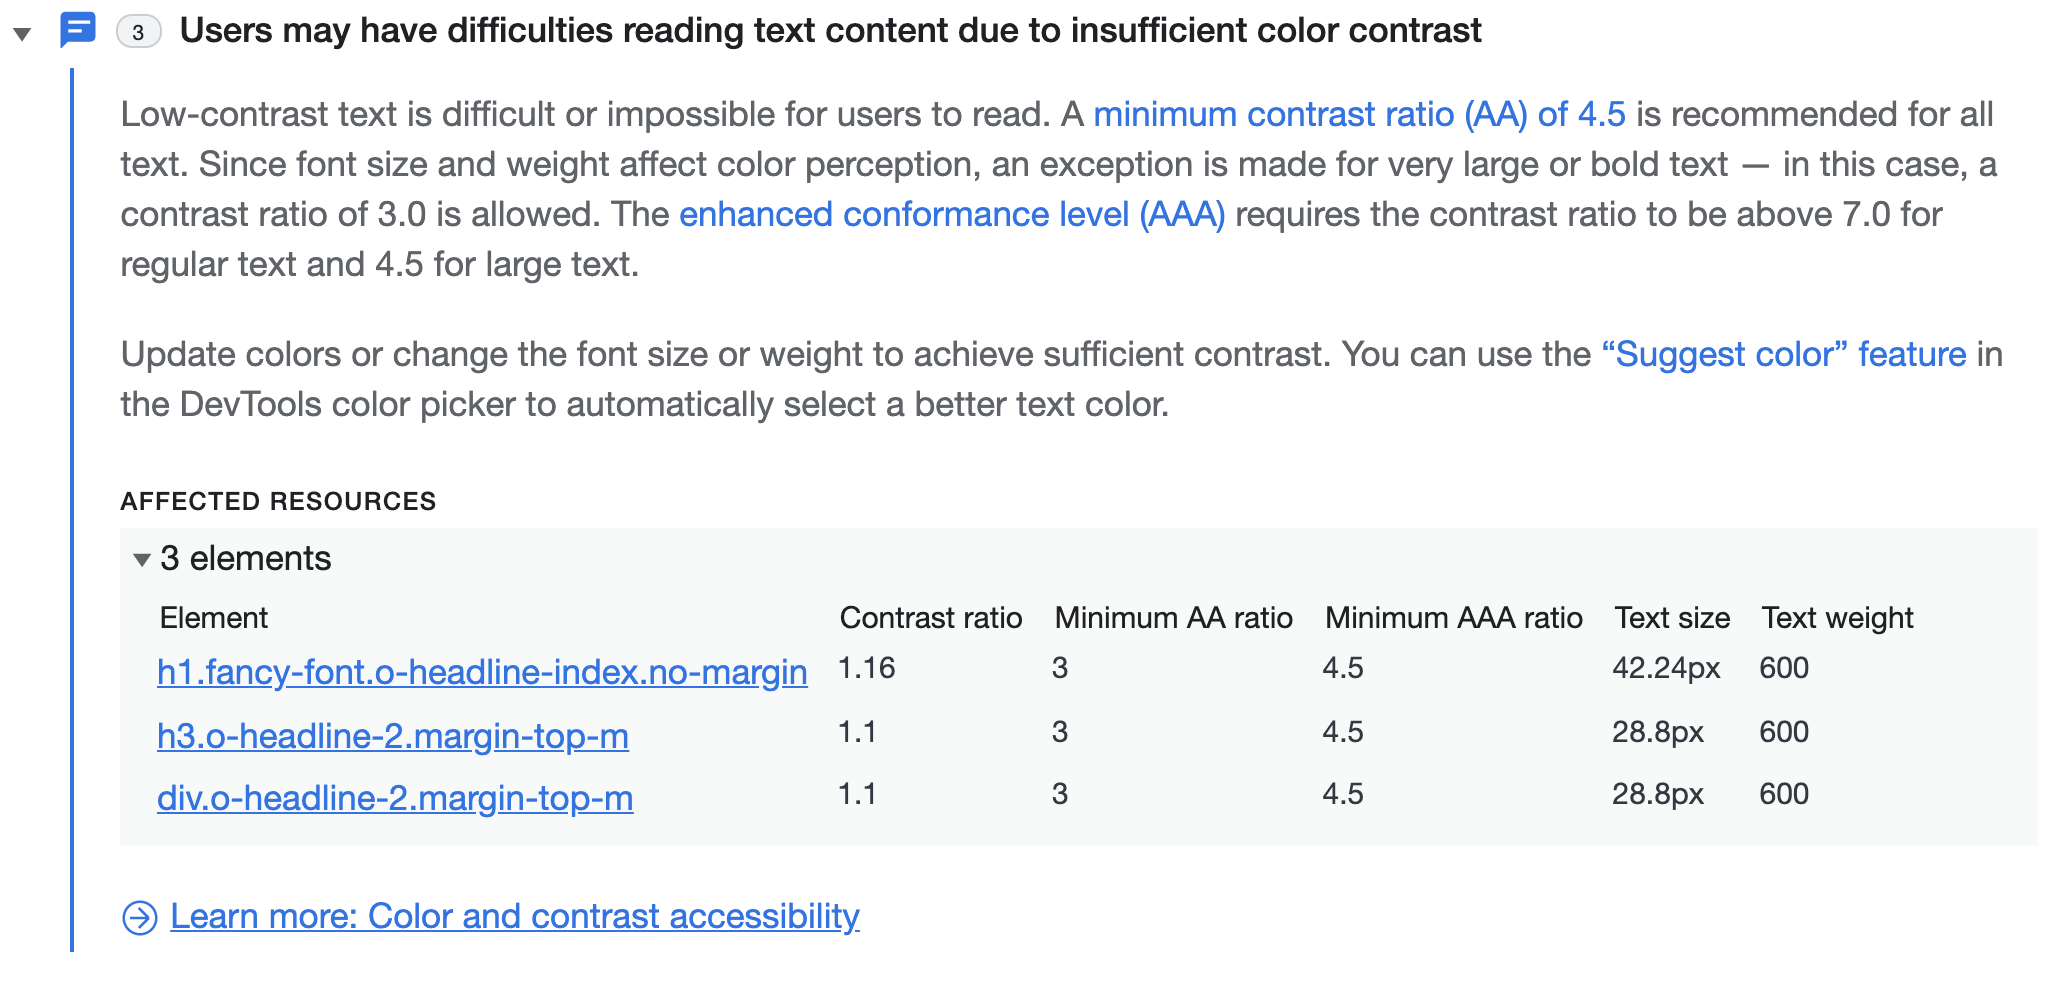
Low contrast text is one of the most common accessibility issues. Tools like Lighthouse check for these when you scan your site, but wouldn't it be great if the DevTools would tell you about issues right away? I (and the Chrome DevTools folks) think so, too, and that's why you can enable "Contrast issue reporting" to see warnings in your console. 💯
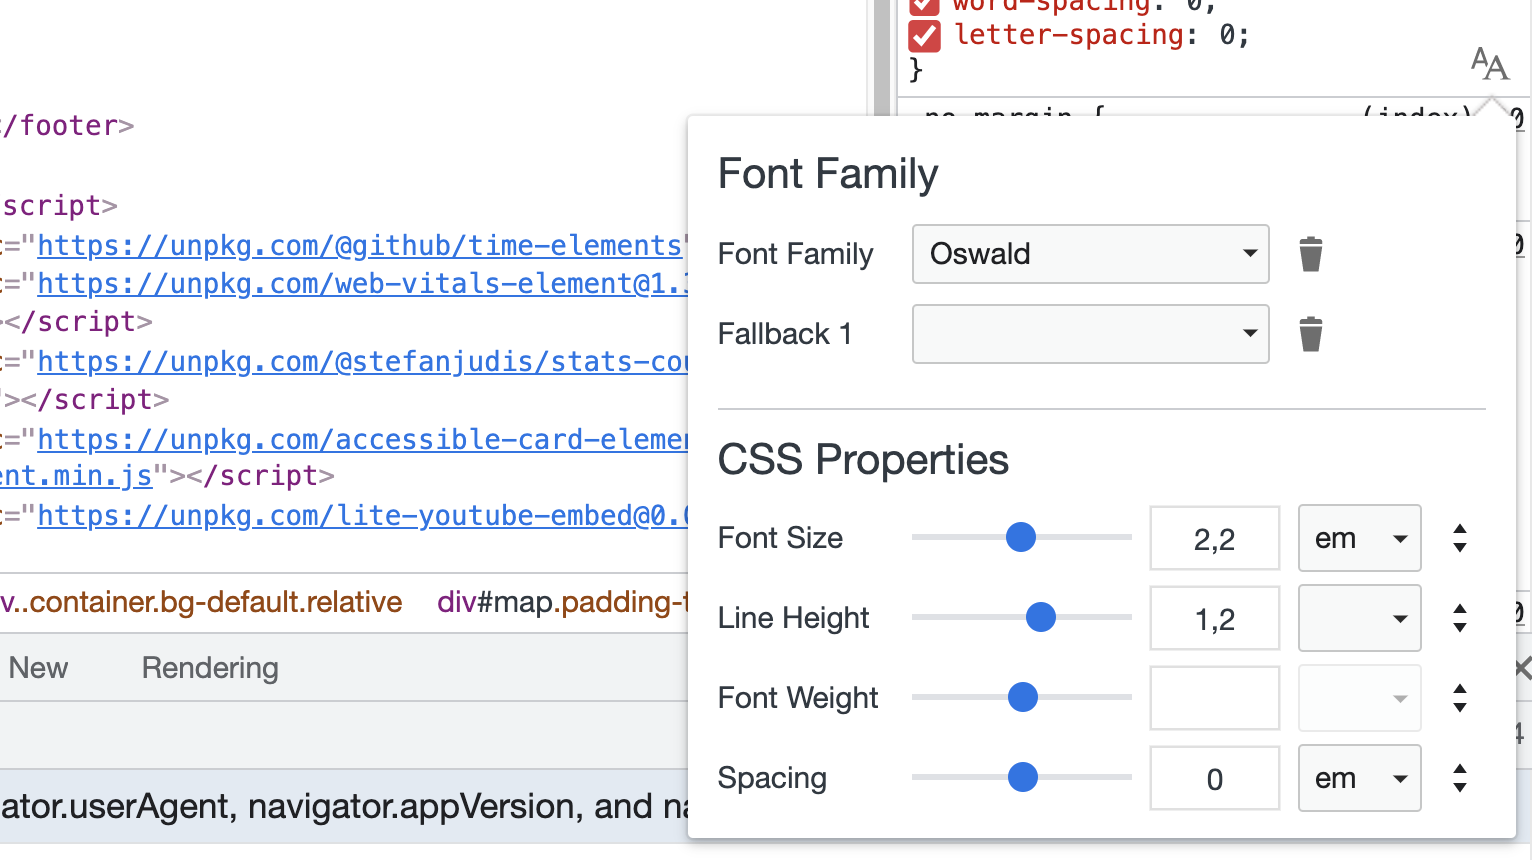
I always found it hard to define and style custom fonts. The new font editor helps with that and allows to change font settings with a visual UI!
I love all this new DevTools functionality and can't wait to see what's next!
Reply to Stefan
This content originally appeared on Stefan Judis Web Development and was authored by Stefan Judis
Stefan Judis | Sciencx (2021-10-01T22:00:00+00:00) Three exciting Chrome DevTools experiments (#blogPost). Retrieved from https://www.scien.cx/2021/10/01/three-exciting-chrome-devtools-experiments-blogpost/
Please log in to upload a file.
There are no updates yet.
Click the Upload button above to add an update.


