
This content originally appeared on Level Up Coding - Medium and was authored by Anurag Srivastava

In this blog, I am going to explain how you can create a sequence diagram using PlantUML. You may have used different applications to create a sequence diagram like paint tool, ppt, Google Slides, Draw.io, or maybe Google Drawing tool. Even I have also used many of these tools to create the sequence diagrams. But once I used Plantuml it has solved all my problems related to the sequence diagram. Using this tool we can easily configure the components and can connect them also if we want to do any modification then that can easily be done by changing the line of code instead of modifying the diagram. But before moving forward let’s understand what is a sequence diagram.
A sequence diagram is a sort of interaction diagram that depicts how a set of items interacts and in what order. Software engineers and business experts use these diagrams to better understand the requirements for the system.
PlantUML is an open-source tool that allows users to generate diagrams using just text. PlantUML supports a variety of different software development-related formats, as well as the visualization of JSON and YAML files, in addition to UML diagrams.
Enough discussion on Plantuml now let’s jump to the practical thing and see how you can quickly create the sequence diagrams using PlantUML. You can use the PlantUML website to create the code and diagram or you can install the PlantUML plugin to your IDE like VSCode. I have chosen the second option where I have installed the PlantUML plugin on VSCode. Once you install the plugin, you can start creating the sequence diagrams by creating and saving a file with the .puml extension. To create your first sequence diagram using PlanyUML you can do the following:
- Create a file as intropuml.puml and open it in VSCode.
- Start the code with a startuml marker and give the name of the diagram. Refer to the below command:
@startuml client-server
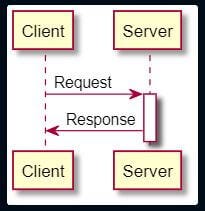
- Here we want to create two boxes for the client and server to show the interaction between the two. So first we need to add those as participants, refer to the below command:
participant Client
participant Server
- Now to show the interaction between the client and server we can mention them using an arrow and can add the connection message after a colon sign. We can use activate to add the block for the component, like if we request to a server then the server should activate. Refer to the below code:
Client -> Server : Request
activate Server
Server -> Client : Response
- Once you are done then end the puml script using the below command:
@enduml
To summarize the above commands, we need to write the following in the intropuml.puml file:
@startuml client-server
participant Client
participant Server
Client -> Server : Request
activate Server
Server -> Client : Response
@enduml
Once you are done with the code you can display the diagram by clicking on the “Preview Current Diagram” after the right click on the code of the file. You can also use the shortcut “ Alt + D” to display the diagram. On the preview you can see the following diagram:
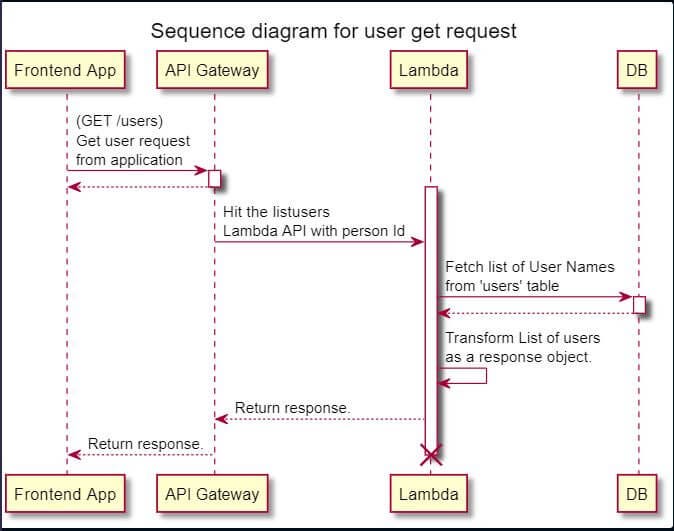
Now take the second example where we want to show the interaction between frontend application, API Gateway, Lambda, and database. Refer to the following code:
@startuml get-user-list
participant "Frontend App" as app
participant "API Gateway" as gateway
participant "Lambda" as lambda
title sequence diagram for user get request
app -> gateway: (GET /users)\nGet user request \nfrom application
gateway -> lambda: Hit the listusers \nLambda API with person Id
lambda -> db: Fetch list of User Names \nfrom 'users' table
lambda -> lambda: Transform List of users \nas a response object.
gateway <-- lambda: Return response.
app <-- gateway: Return response.
destroy lambda
@enduml
In the above code, we have started the UML code and then added the participants for Frontend App, API Gateway, Lambda, and DB. Then we are adding the title for the diagram as “Sequence diagram for user get request”. After the title, we can see the interactions between the components. We can use the “←” double dots to depict the dotted lines for return. We can get the following image by previewing the above code:
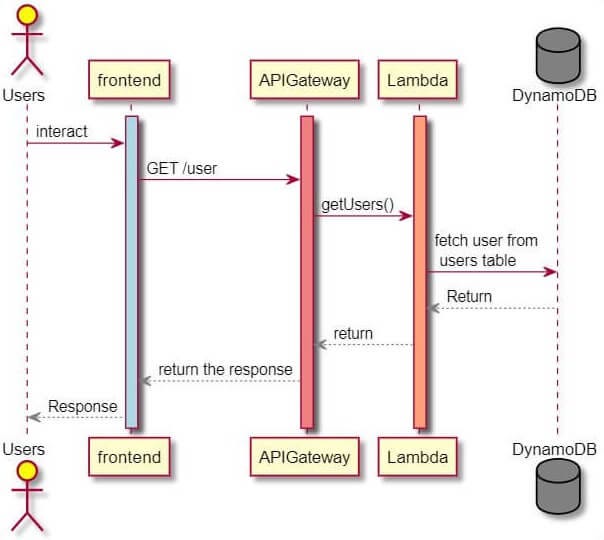
Now, let’s take one more example to understand some formatting options. Please refer to the below code:
@startuml testinganurag
actor Users #Yellow
activate frontend #LightBlue
activate APIGateway #LightCoral
activate Lambda #LightSalmon
Users -> frontend : interact
frontend -> APIGateway : GET /user
APIGateway-> Lambda : getUsers()
Lambda -> DynamoDB : fetch user from\n users table
DynamoDB -[#Gray]-> Lambda: Return
APIGateway <-[#Gray]- Lambda : return
APIGateway -[#Gray]-> frontend : return the response
frontend -[#Gray]-> Users : Response
@enduml
In the above code we are using the actor also that is a user. Also, the color of different components is configured by providing the color name along with activating code. During the interaction, the color of lines can also be changed. By previewing the above code, we can get the following diagram:
So this way we can easily create a sequence diagram using the PlantUML library. It saves a lot of time as we can use the same code and by doing minor changes we can create other diagrams. If you have any queries or suggestions then leave your comment.
You can also follow me on Twitter: https://twitter.com/anu4udilse
If you found this article interesting, then you can explore “Mastering Kibana 6.0”, “Kibana 7 Quick Start Guide”, “Learning Kibana 7”, and “Elasticsearch 7 Quick Start Guide” books to get more insight about Elastic Stack, how to perform data analysis, and how you can create dashboards for key performance indicators using Kibana.
Originally published at https://bqstack.com.
Creating Sequence Diagrams with PlantUML was originally published in Level Up Coding on Medium, where people are continuing the conversation by highlighting and responding to this story.
This content originally appeared on Level Up Coding - Medium and was authored by Anurag Srivastava
Anurag Srivastava | Sciencx (2021-10-29T02:39:26+00:00) Creating Sequence Diagrams with PlantUML. Retrieved from https://www.scien.cx/2021/10/29/creating-sequence-diagrams-with-plantuml/
Please log in to upload a file.
There are no updates yet.
Click the Upload button above to add an update.