This content originally appeared on DEV Community and was authored by Jennie
I believe most of us have seen "Javascript heap out of memory" exception somewhere. What does it really mean?
Well, to answer this question we need to talk a bit about the engine that powers both the Chromium browsers and Node.js - V8, and how it manages its memory consumption.
The memory model
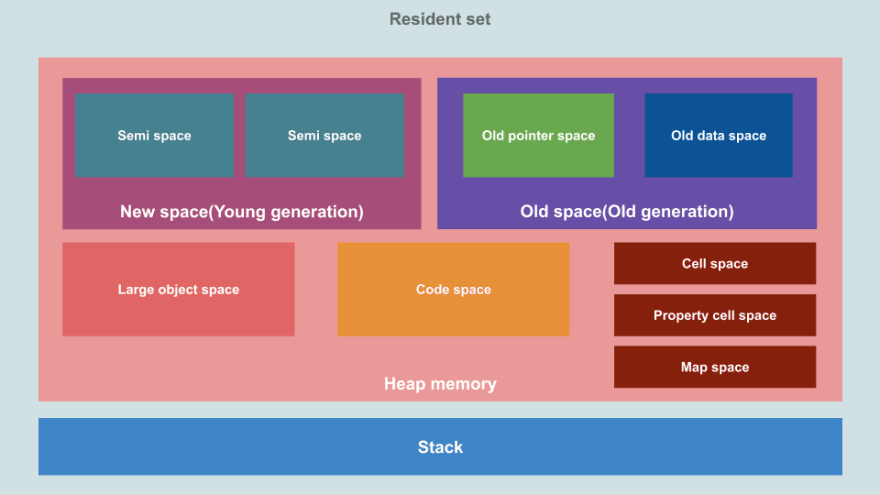
The memory space of V8 is categorised into 2 - Stack memory and Heap memory, and the Heap memeory is further divided into multiple spaces to serve different purposes.
Here is an comprehensive and complicated graph I found in a blog -Visualizing memory management in V8 Engine:
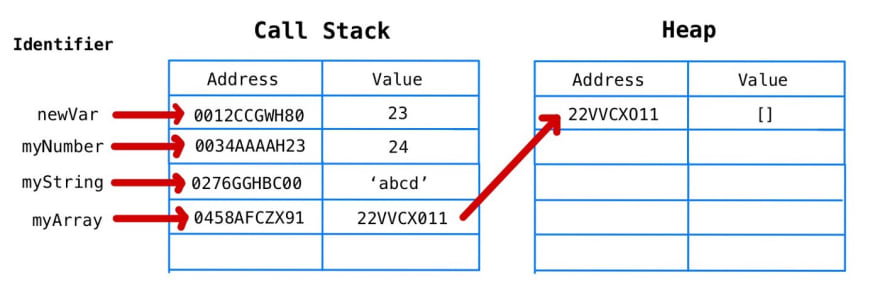
Put aside of the complication first and let's look at how is the memory allocated when running a simple piece of code like this:
const newVar = 23;
let myNumber = newVar;
myNumber += 1;
const myString = 'abcd';
const myArray = [];
The final memory allocation will look like this (from blog JavaScript’s Memory Model):
The static values like number and string are pushed directly into the Stack memory space in order, while the object value is stored into Heap memory, and its Heap memory address is pushed into the Stack. This is generally how Stack and Heap divide the work.
The stack memory
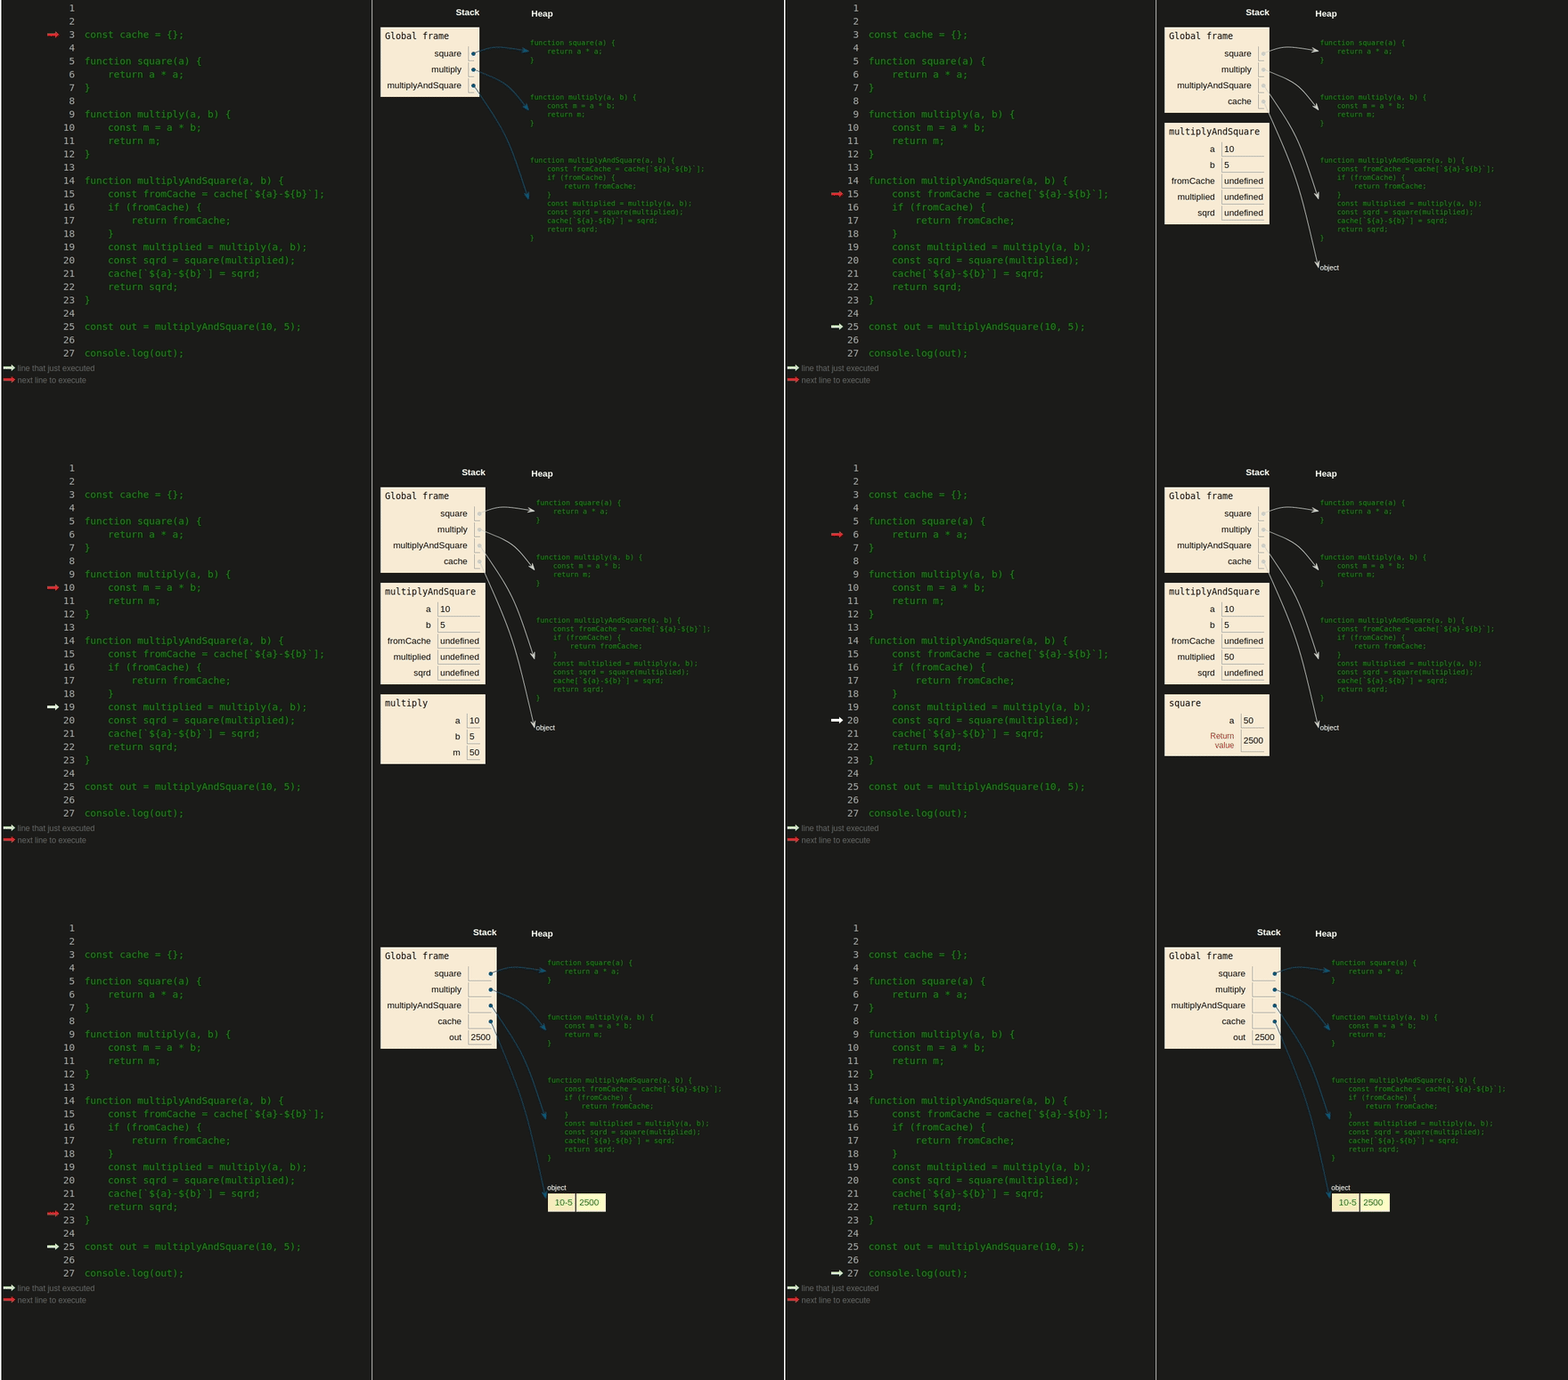
The stack memory (or we often call it call stack) is pretty straight forward. The engine pushes static value in when it runs a line of code declaring new stuffs. If it enters a code block (basically those code wrapped by {}), it may form a stack frame for the declarations inside.
Once the engine finishes running a code block, it pops out the value or the frame to free up the memory space.
(GIF from blog Demystifying memory management in modern programming languages)
Since the nature of the call stack will clear itself, the memory consumption of the call stack is usually not a concern though its space is limited. Unless you've written some function iterating code like I did in my blog Divide and conquer could be tricky in JS - tricks of avoiding maximum call stacks.
To understand further about how Stack and Heap work together, I found this deck is really helpful: https://speakerdeck.com/deepu105/v8-memory-usage-stack-and-heap.
The heap memory
The heap memory stores dynamic data that may change anytime while code is running, and the data may refer to each other. It could be a chaos graph. As a result, in order to know whether a part of memory is still under usage, the engine have to traverse from a set of roots to figure out the the relationship.
Traversing a graph and a potentially giant graph is much much slower than simply push/pop a stack. Therefore, the garbage collection methodologies kick in and play the critical roles in the engine.
I found these methodologies are incredibly interesting.
In V8, the garbage collector is named Orinoco. It divides the heap memory space into 2 regions: young generation and old generation.
This design is based on a generational hypothesis:
In most cases, young objects are much more likely to die than old objects
And the young/old generation take different strategies.
The minor GC for the young generation applies a much faster but space consuming algorithm called Scavenge. V8 allocates much smaller space for the young generation and hence the algorithm runs much more frequently.
The major GC for the old generation applies a slower Mark-Sweep-Compact, and introduced various other methods to compensate for the issues caused by its slowness.
Scavenge of the minor GC (young generation)
The minor GC for the young generation applies a much faster but space consuming algorithm called Scavenge.
It's space consuming as it makes the young generation space split evenly into a from-space and to-space:
(Graph from Trash Talk)
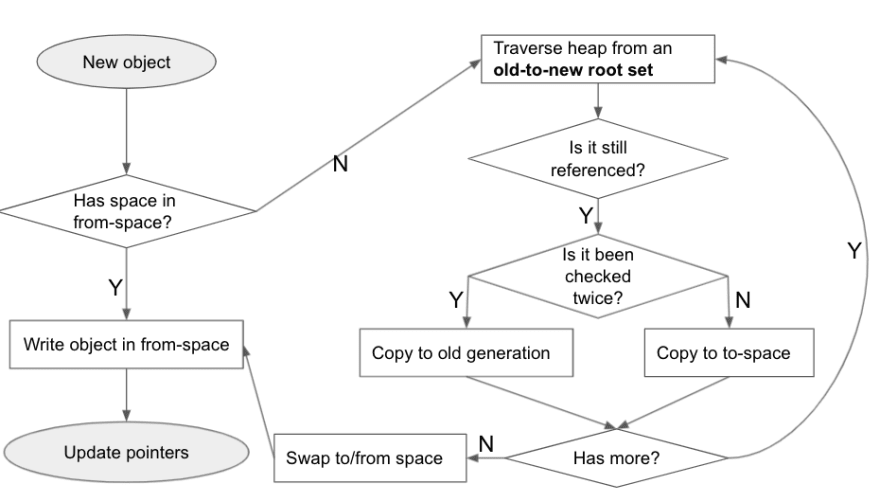
And the process of Scavenge looks like this:
The garbage collection process only starts when a new object comes in and find no more place for it in the from-space. Then it traverses a old-to new root set to figure out whether the object is still alive and whether it has been survived from the last round.
If the object is no longer used, leave it there. If it is still alive and has been survived from the garbage collecting twice, then it will be copied into the old generation. Otherwise, it will be copied into to-space.
Once traversing finished, simply swap the to-space and from-space and update the wrting pointer of the "new" to-space to the start to drop everything left behind.
For this old-to-new root set, I haven't yet dig further to understand completely. According to Trash Talk, it is a small subset maintained by V8's write barriers - the piece of code triggers when Javascript tries to update any object value, which is another long story... V8 has done a lot of other things in the write barriers to assist with the performance improvements according to Concurrent marking in V8.
Mark-Sweep-Compact of the major GC (old generation)
The major GC for the old generation applies Mark-Sweep-Compact.
Mark-Sweep
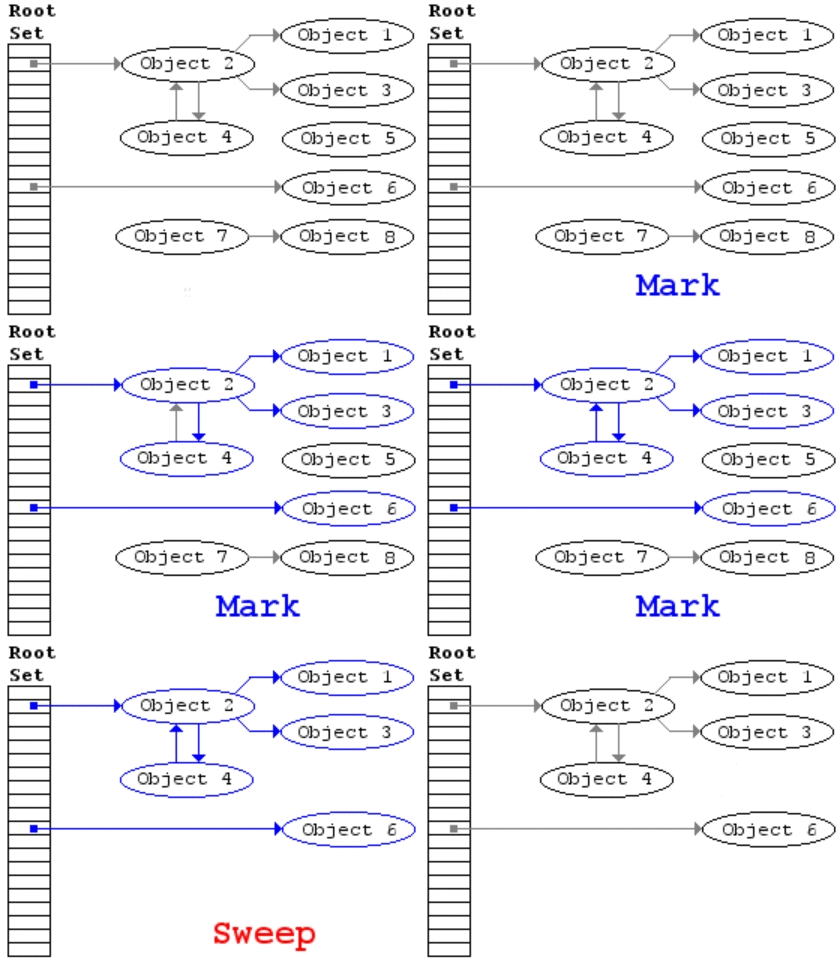
The original and naive Mark-Sweep simply traverses the the whole heap graph to mark the objects still alive and then another walk through of the memory space to remove those not alive any more.
(GIF from Wiki Tracing garbage collection)
This naive approach will stop the world before it finishes its business, and the twice memory reading is not friendly for the memory unit itself.
To improve this, a Tri-color Mark-Sweep was born, and V8 uses this approach. It marks the objects with 3 status instead of simply alive/non-alive:
- White - the initial state of an object.
- Grey - the object is reachable from the root set, and going to be examined or is examining.
- Black - the object has been examined.
Write barriers will mark the new objects as white first. Then when a GC cycle starts, major GC traverses the heap graph from the root set and updates the reachable objects to grey. If all the subsequent paths of the object have been examined, major GC will update the object mark to black.
(GIF from Wiki Tracing garbage collection)
In this process, the grey color serves as an intermediate state, and white, black are the final states. Once a GC cycle finished, the objects left in the white set are not alive and could be recycled.
Comparing to the naive approach, the tri-color approach could avoid the second time traversal in a GC cycle. In the meantime, it could wisely use the intermediate state to allow scripts keep running while marking at the same time.
Compact
After a GC cycle, it could leave various small empty spaces in the memory, and V8 may not able to find a proper space to store a big object as it expects to find a continuous space instead of multiple small spaces. Therefore, it is necessary to compact the memory fragments together and free up some large continuous space in the memory after GC.
Performance improvements for the major GC
The performance improvement battle never ends. And V8 applies several interesting approaches to improve the performance of the major GC, including intremental, concurrent, lazy sweeping and lazy compacting.
Incremental
As Javascript runs in single thread, any extra processes may interrup the script and affect the user experiences.
To minimize the impact, the first thing we can think of is to split the works into smaller sub tasks and runs in between of the script process. So the pauses will be small enough to not be noticed:
(Image from Concurrent Marking)
This approach is called incremental. Sounds familiar? Yes! React Fibre is doing this as well.
However, it has side-effects according to Concurrent Marking:
The application has to notify the garbage collector about all operations that change the object graph. V8 implements the notification using a Dijkstra-style write-barrier.
Because of the write-barrier cost, incremental marking may reduce throughput of the application.
Parrarel / Concurrent
To reduce the side-effects caused by incremental, V8 team introduces multiple threads to help.
This includes parallel:
Parallel marking happens on the main thread and the worker threads. The application is paused throughout the parallel marking phase. It is the multi-threaded version of the stop-the-world marking.
And concurrent:
Concurrent marking happens mostly on the worker threads. The application can continue running while concurrent marking is in progress.
And it's another long long story of how these approaches are implemented. If you are interested in more details, you may read the blog Concurrent Marking.
Lazy sweeping
When we talk about sweeping and freeing up the memory, we usually mean overwrite the memory chunk to "empty", which involves writing and writing consumes resources.
In V8, instead of clearing the space, GC records these "free" memory chunks down into a list, and organize them by the chunk sizes. When a new object comes in, it looks up in this list for an appropriate place to allocate.
Lazy compacting
If you have ever played with the Windows memory compaction program, you will know how slow that compaction could be.
To reduce the impact on performance, GC will only compact some of the highly fragmented pages.
Conclusion & References
This learning opened my eyes of how much complicated things are going on behind our scripts. And I am also wondering whether the complication could be simplified as more mechanisms introduced, may also introduce more consumption of resources. How could we define the balance point?
References:
- Javascript’s Memory Model
- Trash talk
- Visualizing memory management in V8 Engine (JavaScript, NodeJS, Deno, WebAssembly)
- Tracing garbage collection - Wikipedia
- Concurrent marking
This content originally appeared on DEV Community and was authored by Jennie
Jennie | Sciencx (2021-11-04T23:34:27+00:00) Memory Management in V8, garbage collection and improvements. Retrieved from https://www.scien.cx/2021/11/04/memory-management-in-v8-garbage-collection-and-improvements/
Please log in to upload a file.
There are no updates yet.
Click the Upload button above to add an update.


