
This content originally appeared on DEV Community and was authored by Sherfin Shamsudeen
In this tutorial, I will walk you through building a cryptocurrency dashboard in less than 10 minutes, using the ToolJet platform. ToolJet is a free, open-source, low-code platform that allows you to quickly build tools(https://github.com/ToolJet/ToolJet).
Here is the final application that you would have at the end of this tutorial. (This dashboard was created with desktop screens in mind, please make sure you open it from your desktop).
Step 1: Get ToolJet
You can run ToolJet locally or you can create a free ToolJet cloud account (which will be the easiest way to get started).
Step 2: Create an application
Step 2: Create a query to list the major cryptocurrencies
I'm using the API provided by coinstats.app, feel free to use any other API you'd like.
API-URL:
https://api.coinstats.app/public/v1/coins?skip=0&limit=100¤cy=USD
And I'm calling it coinList

And make the query run whenever the application is opened:

Step 3: Add a table and list all the coins on it
The data returned by the query can be fed into the table using its inspector panel which opens up when you click on the table component's handle. Make sure that you've run the query by pressing the play button next to its name, otherwise, the query's data wont be available.

Step 4: Create a query to fetch historical price data
The table row which was last clicked by the user is available in the global variable components as components.table1.selectedRow. Therefore the id of the coin that the user clicked last is available as components.table1.selectedRow.id. (Note that table1 is the name of the table, if you change this, the above code fragment will also change accordingly).
The URL for the query shall therefore be: https://api.coinstats.app/public/v1/charts?period=1m&coinId={{components.table1.selectedRow.id}}
Let's call this query monthData.

Click on one of the rows of the table and run the monthData query to ensure that the query has run and therefore that its response is available.
Step 5: Make sure that the query is run whenever a row is clicked

Step 6: Add a chart to visualize price history
The chart takes in data in the format [{x: 1, y: 1}, {x: 2, y: 2},..].
We can use this snippet to convert the response of our monthData API to this format, where x values are day numbers and y values are the price of the coin in US dollars.
{{queries.monthData.data.chart.map((point, day) => ({
  "x": day,
  "y": point[1],
}))}}

OPTIONAL: Step 7: Repeat step 4 to step 6 to visualize weekly price history as well
This time, for step 4, the URL would become https://api.coinstats.app/public/v1/charts?period=1w&coinId={{components.table1.selectedRow.id}} as we need to get data for one week instead of one month.
For step 5, the query to be run will be the newly created weekData query.
For step 6, the code snippet would become the following, as the query name is different as well as, instead of day, this endpoint brings us price per hour of the coin, hence the variable 'day' is renamed to 'hour'.
{{queries.weekData.data.chart.map((point, hour) => ({
  "x": hour,
  "y": point[1],
}))}}
Step 8: Save, deploy and launch the application!

Done!, we now have a fully functional cryptocurrency dashboard!.
Optional: Make the dashboard look a little better
Styling the table
The appearance of the table can be configured from the inspector panel.
Click on the table, on the inspector panel that opened up on the right, make the following changes:
- Turn off 'Show search box'
- Turn on 'Highlight selected row'
- Change 'Table type' to borderless
You may also adjust the width of the columns to make the table look like this:

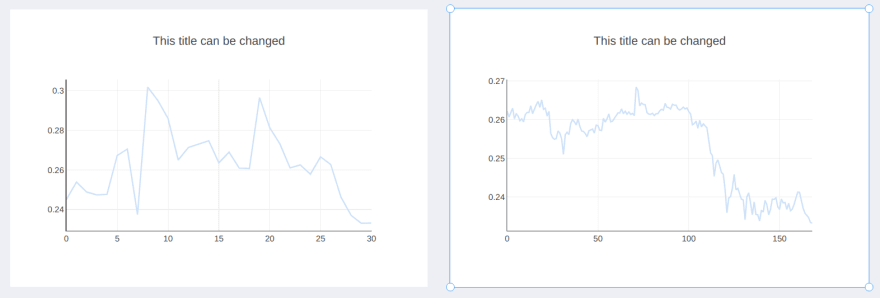
Loading icons and titles for the charts
To show loading icons on the charts, simply fill in their Loading state field on the inspector with {{queries.monthData.isLoading}} for the month level chart and {{queries.weekData.isLoading}} for the week level chart. The isLoading variable is made available with every query, and it indicates whether the query is loading or not.
You can also type in relevant titles for the charts on their Title field, on the inspector.
Making these changes would finally make our application more interactive:

What would you like to build with ToolJet? I'm eager to listen to your ideas, questions and comments.
This content originally appeared on DEV Community and was authored by Sherfin Shamsudeen
Sherfin Shamsudeen | Sciencx (2021-11-18T11:02:19+00:00) How to build a cryptocurrency dashboard in 10 minutes using ToolJet. Retrieved from https://www.scien.cx/2021/11/18/how-to-build-a-cryptocurrency-dashboard-in-10-minutes-using-tooljet/
Please log in to upload a file.
There are no updates yet.
Click the Upload button above to add an update.