This content originally appeared on Bits and Pieces - Medium and was authored by Seth Lutske
Creating performance metrics for your Node.js applications just got much easier

Performance profiling is very useful for finding out where your application is slow, and how you can make it more efficient.
With the right tools, profiling a Node.js application can be fairly straightforward. But the experience described by many tutorials is so involved, and requires the developer to walk through the profiling process step by step, every time.
This article describes how you can automate the process.
Useful tools
In addition to your Node.js project, there are a few tools we’ll need. We’ll go through these more in depth as we outline the process:
A simple application
Let’s start with a simple application we want to profile: an Express server. Your application can be any Node.js program, whether it’s a web server, image file processor, complex mathematical algorithm, or anything else.
The principles we use to profile an Express server can be applied anywhere.
We’ve set up a simple web server, which has two routes.
One performs a simple calculation and returns the result, and the other performs a complex, CPU-heavy calculation, and returns the result.
The server runs on the port specified by process.env.PORT or defaults to port 8080. In our package.json, we create a script to run the server:
Create a profiler
v8-profiler-next is the unofficial (but much needed) successor to the official but obsolete v8-profiler. It offers programmatic tools for starting and stopping the Node.js profiler from within your code, and is compatible with the latest version of Node.js.
For convenience, we can create a profiler class that can help us specify when and where to leverage the v8-profiler:
The Profiler class has methods to start and finish profiling programmatically, if the active condition is met.
On finish, a .cpuprofile file will be written to a /<outputDir> directory (more on .cpuprofile files later).
I recommend adding the profiles directory to your .gitignore file.
Use the profiler…sometimes
The profiler is a powerful tool, but you don’t want to use it every time your server runs. Rather, you’ll want to use only when you want to profile the app.
We can control the flow of whether or not we’re using the profiler by connecting environment variables to the active option when creating a new profiler.
Let’s add some more code to our index.js file:
We created a new Profiler instance that only runs the v8 profiler when process.env.PROFILER exists. As soon as a route is accessed, the profiler starts.
The calculations are performed, and after they are sent back to the requester, the profiler finishes, and writes a .cpuprofile.
All the pieces are in place to profile the application route by route.
Automating the process
While our Profiler is very useful, it still requires a lot of manual work to generate a metric of the app’s performance.
We need to start the server with certain environment variables, then use a tool to make requests to certain routes (a browser, Postman, Apache Bench, etc), and then shut down the server.
But with a bash script and some creative use of PM2, this can all be condensed into a single NPM command.
Let’s add a new NPM script to run a bash script:
This NPM script will run a local bash script in the project’s /scripts directory.
Here’s what that bash script might look like:
Let’s break this down step by step
export PORT=4000
export PROFILER=true
export OUTPUT_DIR=”profiles/$(date +%s)”
- Here we establish some crucial environment variables we saw earlier in the code, which will persist through the life of the shell running this script.
- The server will run on port 4000, but you can choose any port that won’t interfere with other processes you have running. It sets the PROFILER environment variable to true, which means your profiler will actually run.
- It also sets the output directory of any profiling metric files to a unified location. I set it to be a folder named after the unix timestamp of the current moment, but you can choose any unique id.
pm2 start npm — name server-profiler — start
- Here we leverage PM2 to run the npm start command of your package.json.
- It gives a name to the process for PM2’s internal use, which we’ll need in the last step for cleanup.
- A quick view of PM2 running processes after running this command will look like this (pm2 ls):

npx wait-on http://localhost:4000
- Depending on your codebase, you may need to wait for your server to start and become available to take requests before moving on.
- We use wait on to wait for the server to become ready, before pinging it with any requests.
ab -n 1 http://localhost:4000/api/complex > "./${OUTPUT_DIR}/ABResults.txt" 2>&1
- Apache Bench (ab) is a powerful tool for benchmarking servers’ responses to requests. It comes preinstalled in many OSs, and deserves its own series of articles/tutorials to cover its total breadth of power.
- In this case, we’re using it make a single GET request to our server’s api/complex route.
- Apache Bench creates its own output with results about how quickly your server responded. This command writes the results to a file in our directory called ABResults.txt, rather than just printing them to the shell console.
- Apache Bench has other options for outputting results to files as well, but I find its standard output to be the most useful.
pm2 stop server-profiler
pm2 delete server-profiler
- Here we use the name we assigned to our process earlier to do some cleanup.
- PM2 stops the server, and deletes the process.
The Results
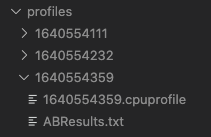
When the bash script is complete, we’ll have a new folder in our projects root directory called profiles, with a subdirectory named after the unix timestamp at which the script ran.
In that folder, we’ll have 2 files — the results of Apache Bench, and the .cpuprofile file:
The Apache Bench results for an example project look like this:
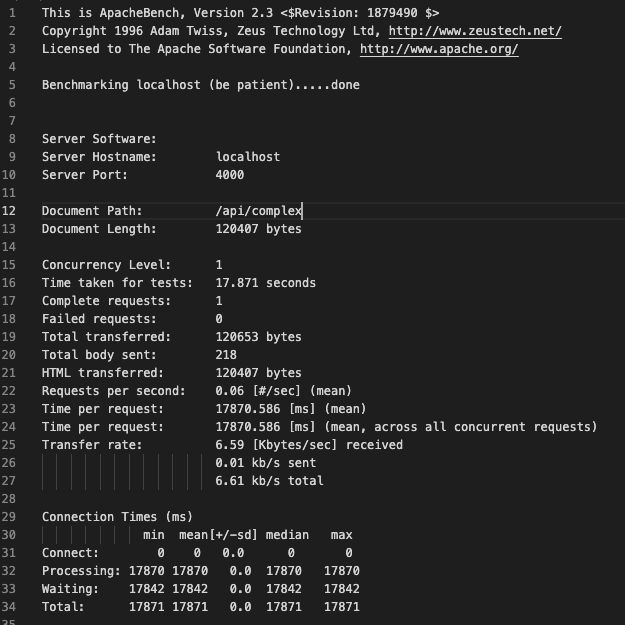
We see that the time per request is over 17 seconds. Terrible!
We can look into our .cpuprofile file for some hints on what is happening. The .cpuprofile file is a measure of how long the CPU spends executing various functions and operations in your code.
It can be viewed in Chrome or VSCode in various ways (as a flamegraph, JSON, or sortable list).
I personally find it most useful to view as a sortable list, sorted by total time:
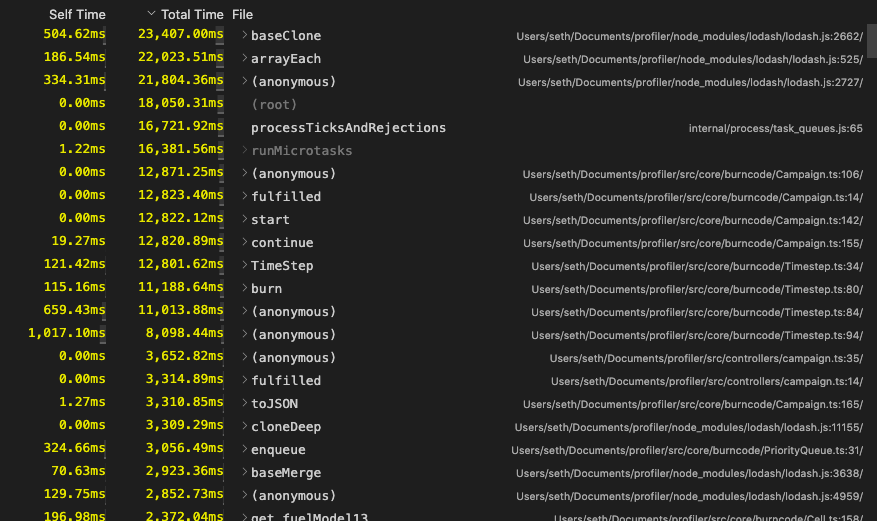
We can see that the CPU is spending quite a lot of time executing lodash cloning functions. A closer look into the top CPU spender:
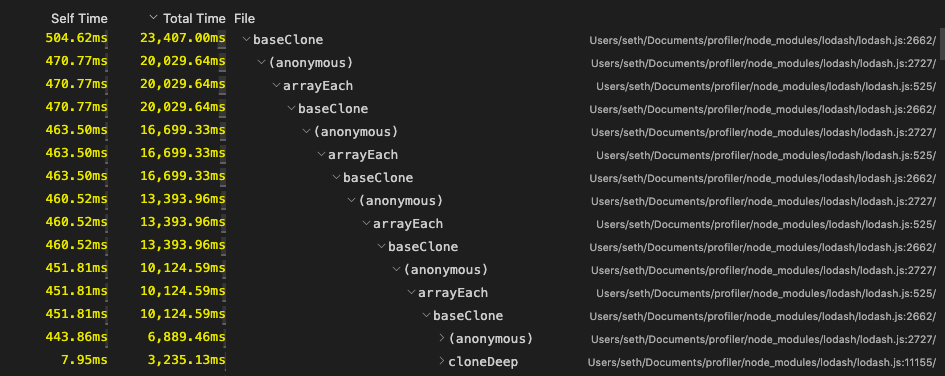
Clearly there is some bad logic in the complexCalculation function causing a recursive use of the clone function, which is slowing down performance. Now we know where to focus our efforts in making the code more efficient.
Conclusion
Setting up a profiling procedure for a Node.js application can be complex and clunky.
Now we can do it with a single NPM script: npm run profile. This will launch your application, make network requests (if necessary), record the performance of both the requests as well as the code itself, and perform all necessary cleanup.
Analyzing the performance of your Node application just became a breeze!
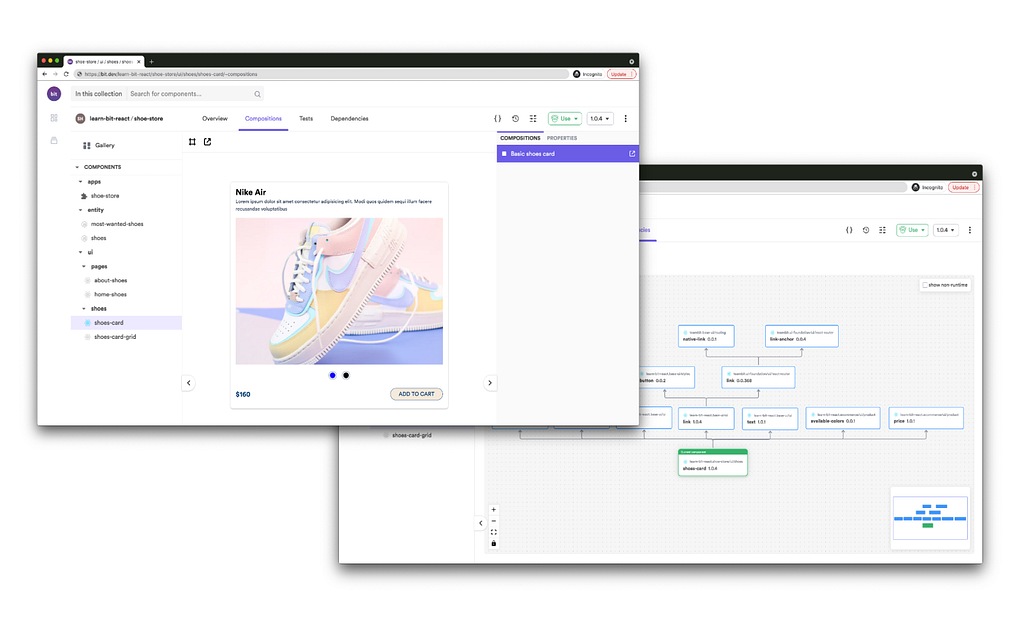
Build Micro Frontends with components
Microfrontends are a great way to speed up and scale app development, with independent deployments, decoupled codebases, and autonomous teams.
Bit offers a great developer experience for building component-driven Micro frontends. Build components, collaborate, and compose applications that scale. Our GitHub has over 14.5k stars!
Learn more
- Building a React Component Library — The Right Way
- Microservices are Dead — Long Live Miniservices
- 7 Tools for Faster Frontend Development in 2022
How to Automate Performance Profiling in Node.js was originally published in Bits and Pieces on Medium, where people are continuing the conversation by highlighting and responding to this story.
This content originally appeared on Bits and Pieces - Medium and was authored by Seth Lutske
Seth Lutske | Sciencx (2021-12-29T11:16:30+00:00) How to Automate Performance Profiling in Node.js. Retrieved from https://www.scien.cx/2021/12/29/how-to-automate-performance-profiling-in-node-js/
Please log in to upload a file.
There are no updates yet.
Click the Upload button above to add an update.
