This content originally appeared on DEV Community and was authored by Guillaume Duboc
If you develop Serverless Applications on AWS, you know how painful it can be to monitor and debug your application from the AWS Console.
A few weeks back, we at Kumo shared why Epsagon is our favorite solution for monitoring our Serverless Applications, after testing most of the Serverless monitoring solutions. Epsagon is quick to install, has instant alarms, great request tracing and enables you to monitor custom KPIs.
But installing a powerful tool isn’t enough. You need to set it up the right way and use it frequently. The following article will help you stay efficient and well organized while setting up Epsagon for the best monitoring experience.
TL;DR
▶️ For the best setup, check the pre-flight checklist.
▶️ Use the Epsagon Serverless Framework plugin.
▶️ Add custom KPIs if desired by calling the Epsagon SDK in you handler
▶️ Setup lambda alarms on an existing and used channel
▶️ Put back together incomplete traces with a custom KPI
What is Epsagon ?
Epsagon comes right out of the box with :
- dashboards you can customize to visualize your application’s performance
- alarms you can configure to report errors on your desired channels
- traces, representing all operations occurring across various services in response of a single trigger. This enables you to quickly debug your serverless application.
- custom metrics tailored to your application business and technical KPIs using Epsagon SDK
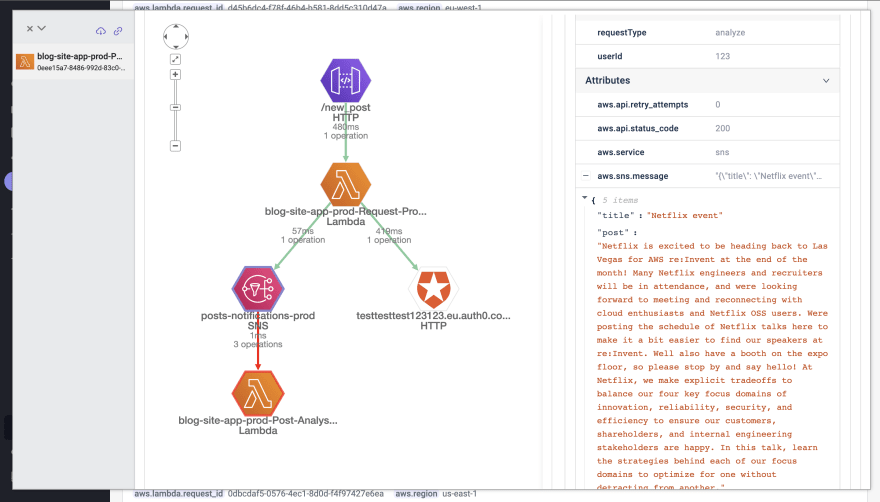
A simple UI provides both an architecture diagram as well as a timeline view of each trace, depending on your needs
Epsagon pre-flight checklist
Before starting the Epsagon installation, in order to have the best quality of monitoring, you should ask yourself the following 3 questions.
- What are my application characterizing identifiers ?
- Think user email, order id
- Think technical KPIs such as
modelName
- What data should be kept private?
- Think identification token, API keys
- Think private user data
- What’s my preferred notification channel ?
- The tool you already use the most might be ideal to receive notification. Nobody likes a never ending pile of automated message on a dedicated and long-forgotten Slack channel
- A tool where you can tag someone or indicate you are taking care of the bug is the best
You are now ready to install Epsagon. You'll have to choose how to install it. Lucky for you, I have tested all of them and resumed it in the next section
Which setup should I use ?
Epsagon gives you 3 different ways of connecting your app to its monitoring solution. You can activate auto-tracing from the Epsagon App, add the Epsagon Serverless Framework plugin to your serverless config or use the Epsagon SDK in all your handlers.
Pros and Cons
| Auto-Tracing | Serverless Framework plugin | Epsagon SDK | |
|---|---|---|---|
| Time | ✅ Fastest | ✅ Fast | ❌ Long Setup |
| Compatibility | ✅ compatible with Epsagon SDK | ✅ you can call the Epsagon SDK in your handler | ✅ compatible with auto-trace |
| Customization | ❌ almost impossible | ✅ very easy in the serverless config, but not complete | ✅ completely customizable |
I recommend using the serverless plugin, with appropriate parameters.
- Give each stack a specific name.
- Indicate Lambda Functions you don’t wish to trace
- Declare the sensitive data you don’t wish to trace
It is still possible to add a custom metric or a warning inside a Lambda Function with the SDK on a per use case basis.
Setup with the Serverless Framework plugin
The Serverless Framework plugin enables you to adapt your setup to your trace(s). Keep in mind these point before the installation
- It traces all Lambda Functions of your stack immediately after the first deploy
- Configure stack, and function monitoring in your serverless config file
- Filter sensitive data on your AWS account before it’s shipped to Epsagon backend
- This data will not be sent in the trace and you will not see it in the tags anymore. Otherwise the data is sent on Epsagon’s stack to be accessible on the app
- list them in
ignoredKeysin your config
- Ignore specific ingoing or outgoing http request
- specify an array of url patterns in
urlsToIgnorein your config
- specify an array of url patterns in
- Trace Step Functions inside a State Machine
- specify in the config
wrapper: 'stepLambdaWrapper'
- specify in the config
You can now follow the installation instruction
For the best integration, you will have to deploy an Epsagon stack on your AWS account.
- Log in to https://app.epsagon.com/quickstart.
- Follow the quick start and click on
Monitor Your Environment - Select AWS
-
Integrate AWSwill redirect you to the AWS console, where you can deploy the Epsagon stack
Adding custom business KPI
Since the Epsagon plugin requires the epsagon module, you can use the SDK inside your Lambda Function to monitor any KPI you want.
Here is a snippet as example
import epsagon from 'epsagon'

const main = () => {
    // my function handler
    epsagon.label("myCustomKPI", 42);
}
The plugin will take care of initiating Epsagon and wrapping the handler.
Similarly, you can use setError and setWarning to have an event in the Epsagon App, without throwing an error in your code.
Setting up alarms
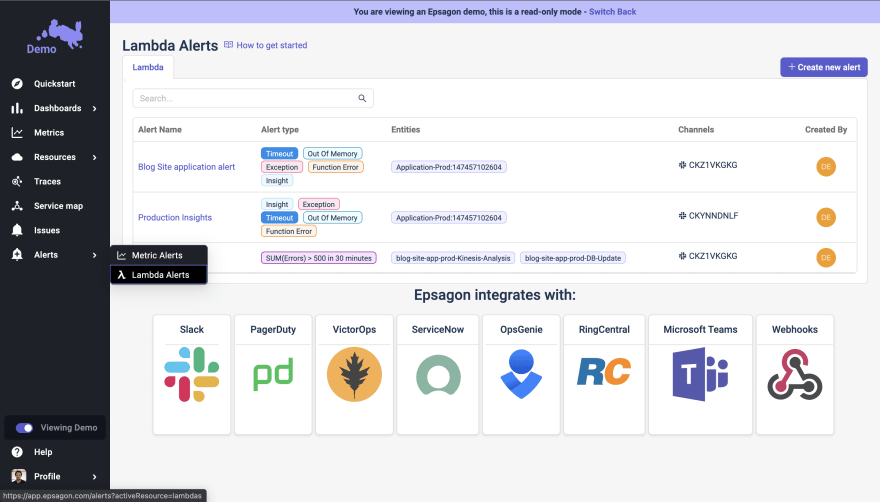
To maintain the quality of your app, you need to be notified whenever an error occurs. Automatic alerts limit bug impact as we are aware of its presence sooner.
You can easily set up an alarm on lambdas, or on a metric you selected
-
Exceptionrefers to Errors thrown by your lambda -
Function Errorrefers to a Lambda Service error -
Out Of Memoryrefers to a Lambda Function running out of memory -
Timeoutrefers to a Lambda Function reaching its configured timeout -
Insightrefers to being close to one of the two previous limits
Setting up my traces
In a serverless architecture your operations are often distributed across multiple different services. In your AWS console, it is painful and time consuming to investigate the origin of a bug. Tracing gives you the possibility to quickly understand the context of your error and its timeline.
You should index the identifiers you selected before starting the installation in order to make them easily searchable throughout your traces data.
Example : Considering an e-commerce application, you may have some of your EventBridge events containing an orderId attribute. Indexing this attribute to make it searchable will allow you to easily recover all traces resulting from any EventBridge events related to a specific order.
- For a simple tag you can add it by clicking the + on the right
- You can expand a nested attribute and visualize the entire data
- To tag as searchable a nested property, click on
Set Searchable Tags, and pick the tag you are interested in
You can now create a dashboard, an alarm or find a trace with that specific data.
Setting up a dashboard
You can create graphs, and thus dashboards or alarms on 2 types of metrics :
- Epsagon traces : they are great for monitoring custom metrics and lambda oriented data (trigger data, return data)
- CloudWatch metrics : these are the same metrics than the ones in CloudWatch, but you can easily create a custom graph
To create a good looking, changeable dashboard, you can create variables. These are modifiable at the top of your dashboard. You can refer to them in the graphs of your dashboard.
💡 ⚠️ Beware, if an alias is used to specify the region, auto-complete will be broken
→ fix : pick a region, then fill the parameters and finally switch back to alias as region
Finally, you are almost done !
In order to ensure your application monitoring is correctly setup, you should perform a simple check : does all operations across all services resulting from a single trigger appear in one single trace ?
▶️ If you do, congrats 🎉! You can now safely operate your application and react efficiently in the case of a problem.
▶️ If not, you need to “manually” assemble traces : keep on reading.
What if it doesn’t work?
What if instead of having a single, complete trace, you have a cropped one.
This is of course not an ideal situation but it can happen. Some services might not be instrumented yet (here is a list of supported services). In other cases, some API of the AWS SDK itself might be problematic (here EventBridge JavaScript SDK v2 is properly traced but not v3).
In that case, you should open an issue or contact the Epsagon team.
While you wait for an updated Epsagon instrumentation, you can implement a contingency strategy.
You can use custom metrics to log the event Id. Here is a code snippet representing this example
// sendMesage.ts

import { EventBridge, PutEventsCommand } from '@aws-sdk/client-eventbridge';
import epsagon from 'epsagon';

const eventBridge = new EventBridge({});
export const handler = () => {
    // ...
    const event = await eventBridge.send(
    new PutEventsCommand(input),
  );
  if (event.Entries && event.Entries[0].EventId) {
    epsagon.label('EventBridgeEntries', event.Entries[0].EventId);
  }
}
// eventBridgeWorker.ts

import epsagon from 'epsagon';

export const heandler = async (event: {
  id: string;
}) => {
  epsagon.label('EventBridgeEntries', event.id);
    // ...
};
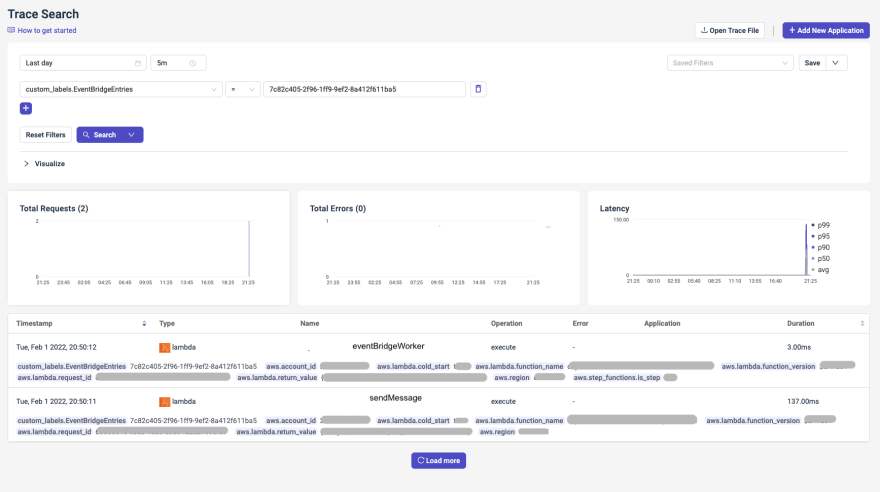
By clicking on the search icon next to the label, you can find the all the Lambda Function that consume or emitted the event.
You can now connect the 2 traces !
Conclusion
In order to make the most of Epsagon as a monitoring solution, I believe you should
- Check the pre-flight checklist
- use the Serverless Framework Plugin for Epsagon
- Add custom KPIs to monitor your application
- set up alarms to have the shortest lead time when a bug occurs
- use traces to find the origin of your bugs and be able to reproduce your errors
- use custom metrics to link incomplete traces
Finally, monitoring your Serverless Application will be painless 🚀
Don’t hesitate to share in the comment section your tips and tricks when using Epsagon !
Guillaume Duboc is software engineer at Kumo, serverless expertise by Theodo
This content originally appeared on DEV Community and was authored by Guillaume Duboc
Guillaume Duboc | Sciencx (2022-02-08T14:03:45+00:00) Monitor and Debug your Serverless Applications Painlessly with Epsagon. Retrieved from https://www.scien.cx/2022/02/08/monitor-and-debug-your-serverless-applications-painlessly-with-epsagon/
Please log in to upload a file.
There are no updates yet.
Click the Upload button above to add an update.


