This content originally appeared on Level Up Coding - Medium and was authored by Prateek Chhikara
How to evaluate the performance of text summarization models

We use the most widely and standard metrics for most Natural Language Processing tasks, such as accuracy or f1-score. However, for text summarization and text translation tasks, these metrics are not that helpful in depicting the performance of a model, as these metrics cannot be used directly on a text sequence to evaluate the quality of the generated summary or the output of a machine translation system. Therefore, we need a metric that can be used to assess the summary produced by these algorithms. There are several performance metrics to evaluate the performance of such use-cases, such as BiLingual Evaluation Understudy (BLUE) and Recall-Oriented Understudy for Gisting Evaluation (ROUGE). In this article, we will be covering the ROUGE scores only.
What is the ROUGE metric?
ROUGE is a set of metrics for evaluating automatic summarization of texts and machine translations [1]. There are several variants of the ROUGE metric; however, the basic idea behind them is to allocate a single numerical score to a summary that tells us how good it is compared to one or more reference summaries [2].
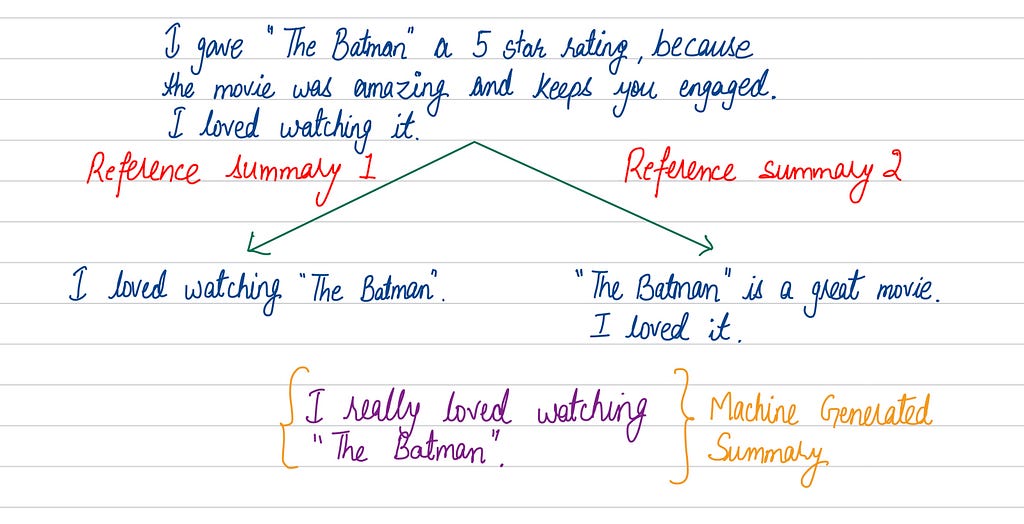
For instance, in the example shown in Figure 1, we have a movie review of the movie “The Batman” and a summary that a model has generated. If we compare the generated summary to a reference human summaries, we can see that the model is performing well and only varies by a few words.

Measure the quality of a Generated Summary
ROUGE compare the n-grams of the generated summary to the n-grams of the references. There are several types of ROUGE metrics, such as ROUGE-1, ROUGE-2, ROUGE-L, etc.
To understand how well a summary is generated, let’s take the example sentences shown in Figure 2.

ROUGE-1
It compares the uni-grams between the machine-generated summary and the human reference summary. We have separate RECALL and PRECISION for the ROUGE-1 metric.
ROUGE-1 recall is the ratio of the number of words that match (in machine generated summary and the human reference summary) and the number of words in the reference. Therefore, for the example in Figure 2, the ROUGE-1 recall is 5/5 = 1. Now a question arises, that is, using only ROUGE-1 recall is sufficient? The answer to that is a NO…!!!
What if the machine-generated summary is as follows:
I really really really really loved watching “The Batman.”
In this case, we will also get the ROUGE-1 recall as 1. It has a perfect recall, but the summary is terrible. Therefore, we need precision as well.
ROUGE-1 precision is the ratio of the number of words that match and the number of words in the summary. Therefore, for the example in Figure 2, the ROUGE-1 precision is 5/6 = 0.83.
Finally, we calculate the harmonic mean of the two, also known as the f1-score. f1-score = (2 x precision x recall) / (precicion + recall)

ROUGE-2
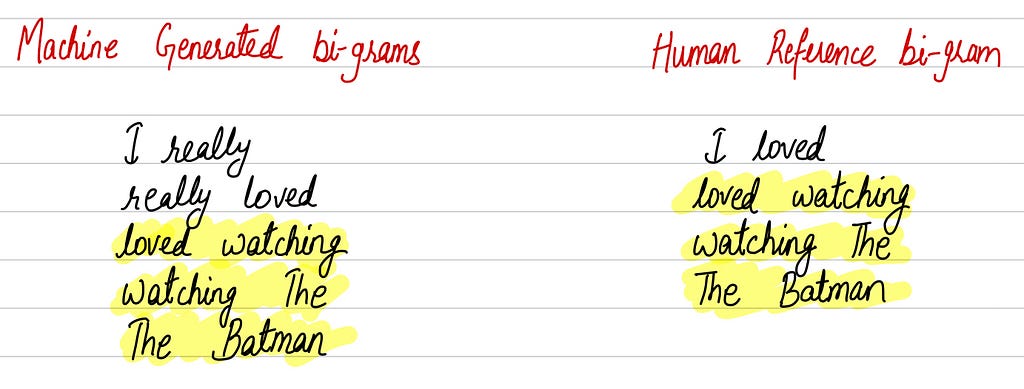
For ROUGE-2, we use bi-grams in place of uni-grams. Here also, we calculate PRECISION and RECALL. Consider the similar example as mentioned in Figure 2. First, as shown in Figure 3, we create bi-grams and use the same formula that we used for ROUGE-1 to calculate the precision and recall.
ROUGE-2 recall is the ratio of the number of bi-grams matches and the number of bi-grams in the reference. Therefore, for the example in Figure 2, the ROUGE-2 recall is 3/4 = 0.75. Similarly, the ROUGE-2 precision is the ratio of the number of bi-grams matches and the number of bi-grams in the generated summary. Therefore, for the example in Figure 2, the ROUGE-2 precision is 3/5 = 0.60.

ROUGE-L
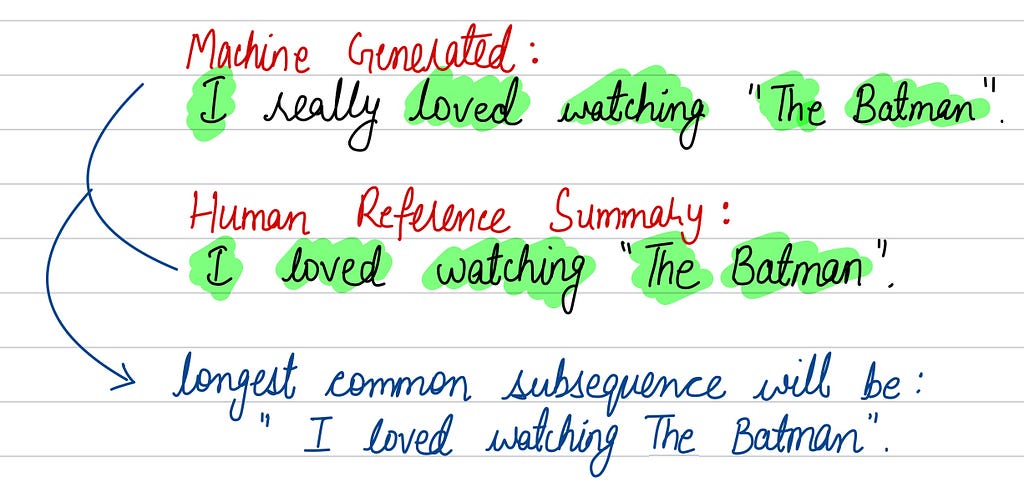
ROUGE-L doesn’t compare n-grams; instead treats each summary as a sequence of words and then looks for the longest common subsequence (LCS). Figure 4 shows the LCS between the machine-generated and human reference summaries.
ROUGE-2 recall is the ratio of the length of LCS and the number of words in the reference summary. Therefore, for the example in Figure 2, the ROUGE-L recall is 5/5 = 1. Similarly, the ROUGE-L precision is the ratio of the length of LCS and the number of words in the generated summary. Therefore, for the example in Figure 2, the ROUGE-L precision is 5/6 = 0.83.
The advantage of using ROUGE-L over ROUGE-1 and ROUGE-2 is that it doesn’t depend on consecutive n-gram matches, and it tends to capture sentence structure much more accurately.
Conclusion
This article mentions the need for ROUGE metrics to evaluate the performance of a text summarization model. In addition, three different types of ROUGE metrics are discussed with examples.
References
- CY. Lin. “Rouge: A package for automatic evaluation of summaries.” In Text summarization branches out, pp. 74–81. 2004.
- P. Singh, P. Chhikara and J. Singh, “An Ensemble Approach for Extractive Text Summarization,” 2020 International Conference on Emerging Trends in Information Technology and Engineering (ic-ETITE), 2020, pp. 1–7.
Performance Analysis of Text-Summary Generation Models Using ROUGE Score was originally published in Level Up Coding on Medium, where people are continuing the conversation by highlighting and responding to this story.
This content originally appeared on Level Up Coding - Medium and was authored by Prateek Chhikara
Prateek Chhikara | Sciencx (2022-02-18T12:55:50+00:00) Performance Analysis of Text-Summary Generation Models Using ROUGE Score. Retrieved from https://www.scien.cx/2022/02/18/performance-analysis-of-text-summary-generation-models-using-rouge-score/
Please log in to upload a file.
There are no updates yet.
Click the Upload button above to add an update.
