This content originally appeared on Level Up Coding - Medium and was authored by Lars Kiefer
Production simulation based on React, Flask and OntologySim
Idea
A challenge when using manufacturing simulations built e.g. in Python is the lack of graphical visualization. This aspect is especially relevant when new strategies, methods and algorithms have been developed. The comprehension of decisions is essential for the rapid development of algorithms (i.e. scheduling, dispatching, production control). So far, open-source simulations written in Python lack the ability to produce a nice, smooth and useable graphical visualizations compared to the large commercial simulations, like AnyLogic, PlantSim.
Content
- Showing and comparing options for graphical visualizations in Python-based manufacturing simulations
- Example for using graphical Simulation with OntolgySim
Option 1: offline Application with Tkinter
Tkinter is a library for 2D drawing surfaces, so simple shapes can be displayed.
All relevant data, which should be visualized, like machines, products must be created at each time step to produce a static picture. Due to the static representation, there are several drawbacks, which limit especially the user-friendliness:
- Drag and drop of elements: e.g. if simulations are created
- Selecting elements: showing more information for e.g. products
- Options like zooming pane: for large simulations, dynamic adjustment of the visible surface
Furthermore, the opportunity to run the program on servers without a graphical interface is not possible.
Option 2: Using JavaScript for visualization
The idea is to make use of the power of JavaScript for graphical implementation. To connect Python and JavaScript, a web server is needed. Python with the package Flask enables data transfer via an API. As a JavaScirpt Framework, React is used.
The conceptual process is as follows:
- React, used for graphical implementation, sends an API request to Python to get the latest simulation status
- In the next step, all relevant data is extracted, processed and sent back via AJAX calls to React.
- Subsequently, the visualization can be built based on the current simulation data. For the visualization, for example, React Konva is suitable. The creation of objects is similar to Python, the big advantage is just that through dynamic rendering opportunities like zooming, drag and drop, elements clicking become possible with little effort.
- The dynamic visualization allows making changes to the simulation via callbacks, but also to display additional data via clicking.
However, a higher programming effort is necessary at the beginning, due to the setup of the webserver.

Another big advantage of the implementation as a full-stack application is the possibility to set up a complete dashboard for the simulation. Thus, in this case, event data, KPIs can be quickly visualized graphically and increase further graphical modelling.
Example for Fullstack application with OntologySim
Using the example of the open-source simulation package OntologySim and the extension implementation with React, a concrete implementation is shown. The installation of the simulation and the graphical visualization is shown below.
Implementation
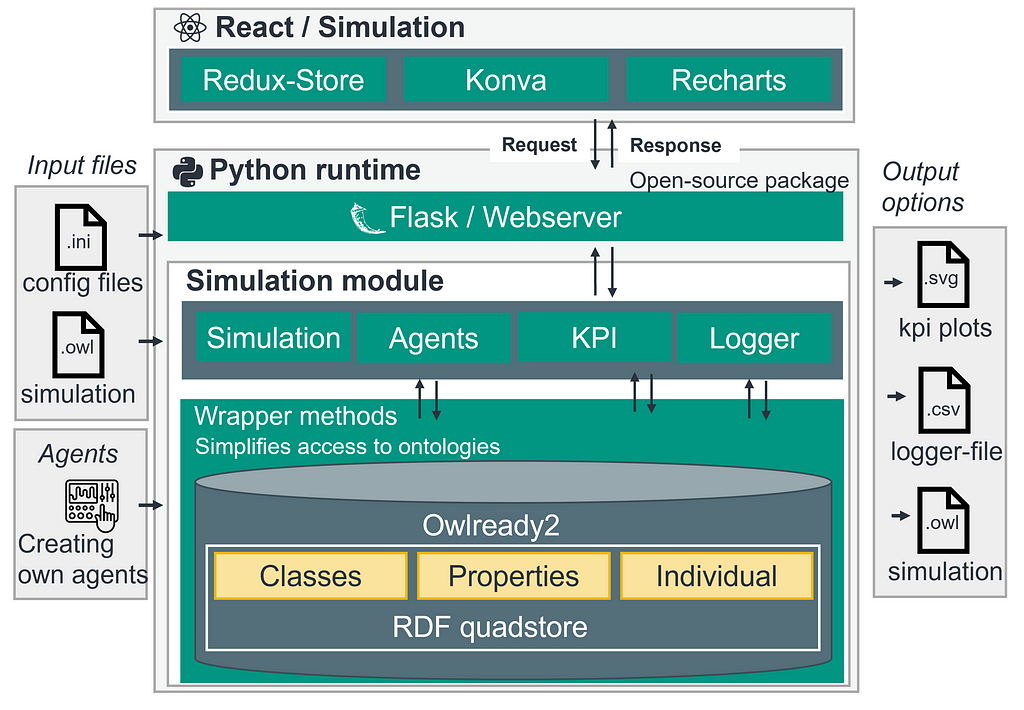
The implementation of the simulation is based on the full-stack application of React and Flask. The basis of the simulation is an ontology, which stores all states and allows great flexibility. For accessing the ontology via the graphical user interface, all-access operators were wrapped in separated wrapper methods in Python and provided as an API interface. Via AJAX calls, the frontend application is linked to the backend. It should be noted that the Ajax call is not a state-less API, because the simulation states are stored on the server. The figure shows the used libraries and custom programmed libraries.
Possibilities
In summary, the combination of React, Flask and OntologySim enables the following:
- Graphical visualization of production layout, KPIs
- Start and export simulation via a graphical interface
- Viewing of simulation steps, including the possibility to go back
- Filtering, sorting and displaying of events
Installation
For setting up the simulation, both the front end and the backend must be installed. For the installation, you need node -v 16.13.1 and python>3.6.
1) Installation Frond end
The simulation is available via GitHub
git clone https://github.com/larsKiefer/ontologysim_react
cd ontologysim_react
There are 2 ways to install. The first option is an installation via Docker and Docker compose
docker-compose up — build
The second option is an installation via npm.
npm install
npm start
After successful installation, the call from localhost:3000 should be possible.
2) Installation Back end
For the installation of the backend, the download is available via pip
pip install ontologysim
Then pls create a python file with the following two lines.
As a next step, you need to run the newly created file in the command. Afterwards, the installation can be tested with the following input into the browser
localhost:5000/test
Analysis of simulation
The graphical display of the simulation allows the specific analysis of the simulation. Both event logs and KPIs are available for this purpose. Due to the ontology in the background, it is possible to go back and forth through the event steps. This means that individual steps can be repeated several times.
1) Upload simulation configuration
The first step is to load the configurations under the tab “upload”. The configuration types can be found here: https://ontologysim.readthedocs.io/en/latest/, but there is also the possibility of using a sample simulation. After loading the simulation, the following analysis options are available:
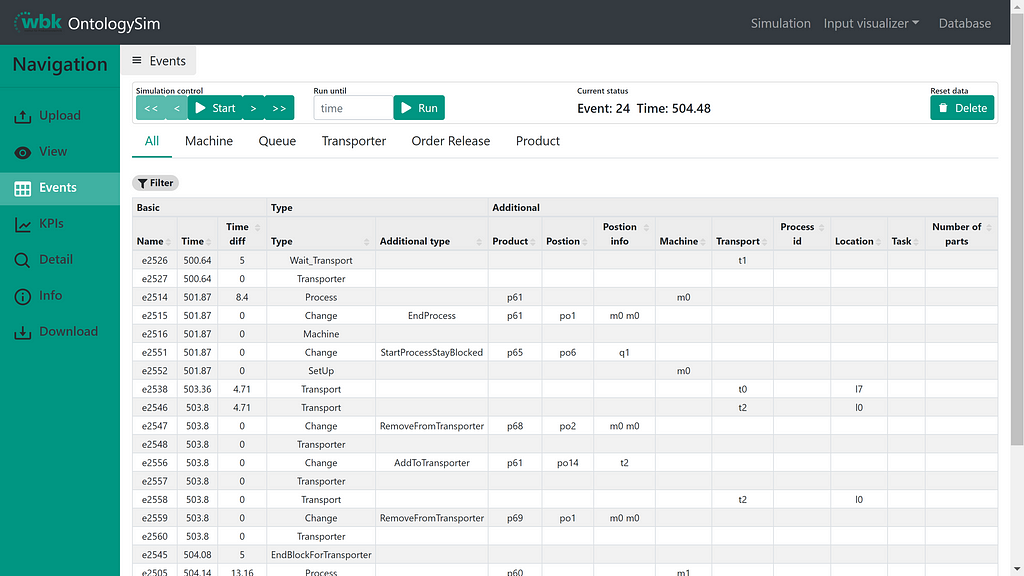
2) Event log
The software allows you to trace all events with the possibility of sorting and filtering the data.
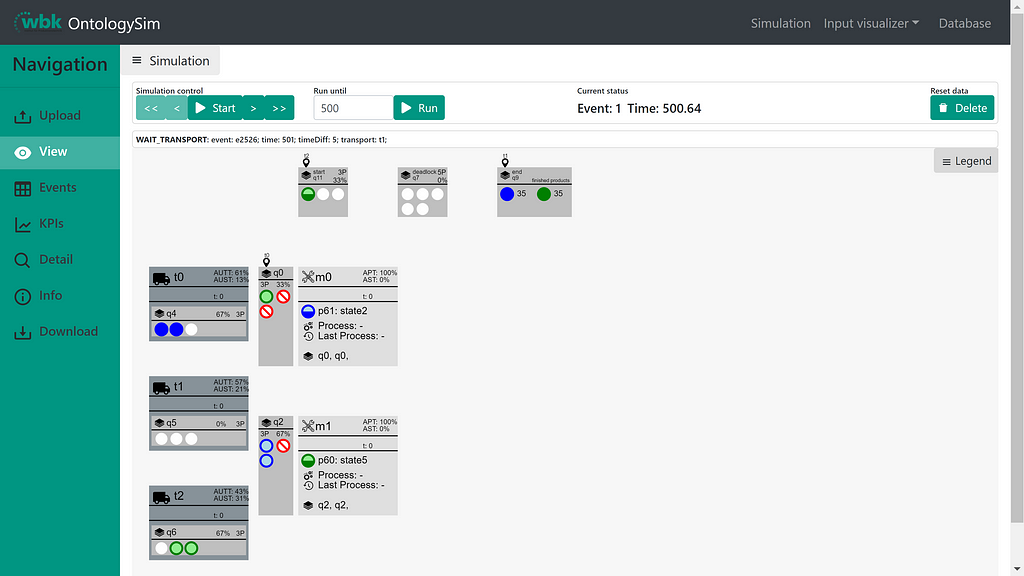
3) Simulation visualization
Under the view tab, the decisions of the controllers are visualized graphically. There is a possibility of going backwards to better analyse decisions.
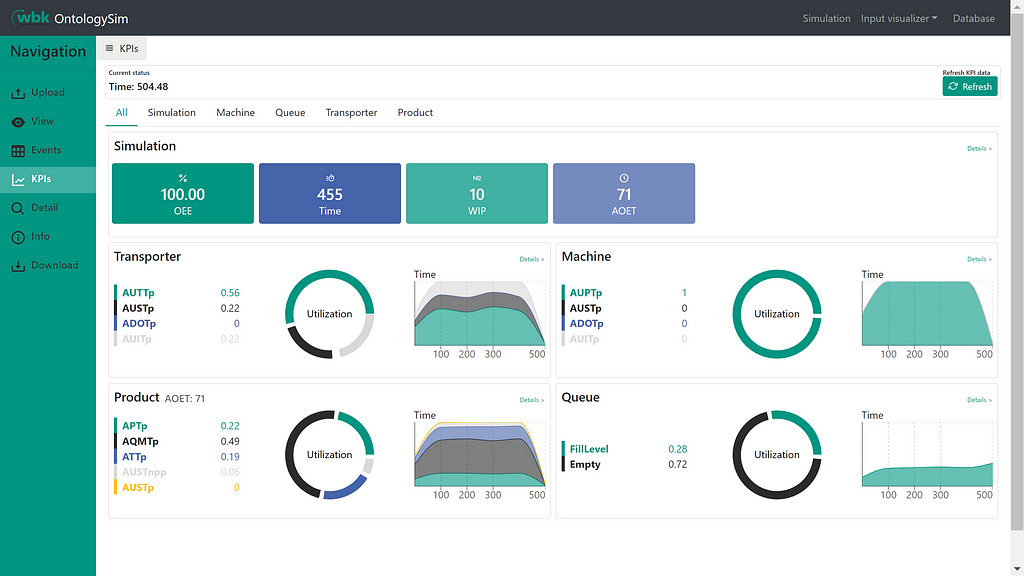
4 ) KPI storage
After the simulation has progressed, the KPIs can be displayed in a graph. Furthermore, there is the possibility of exporting the KPI results.
Conclusion
Thanks for reading. If you have anything to add, please feel free to leave a comment!
For technical explanations, basics and literature review for OntologySim the journal can be found here: https://doi.org/10.3390/app12031608
Reference:
Thanks to the supporter of this work: Marvin Carl May, Andreas Kuhnle and Gisela Lanza
This research work was undertaken in the context of DIGIMAN4.0 project (“DIG- 565 Ital MANufacturing Technologies for Zero-defect Industry 4.0 Production”, http://www.digiman4- 566 0.mek.dtu.dk/). DIGIMAN4.0 is a European Training Network supported by Horizon 2020, the EU 567 Framework Programme for Research and Innovation (Project ID: 814225)
Source
[1]: May MC, Kiefer L, Kuhnle A, Lanza G. Ontology-Based Production Simulation with OntologySim. Applied Sciences. 2022; 12(3):1608. https://doi.org/10.3390/app12031608
HowTo: Developing a full-stack production simulation with Python and React was originally published in Level Up Coding on Medium, where people are continuing the conversation by highlighting and responding to this story.
This content originally appeared on Level Up Coding - Medium and was authored by Lars Kiefer
Lars Kiefer | Sciencx (2022-03-28T01:15:22+00:00) HowTo: Developing a full-stack production simulation with Python and React. Retrieved from https://www.scien.cx/2022/03/28/howto-developing-a-full-stack-production-simulation-with-python-and-react/
Please log in to upload a file.
There are no updates yet.
Click the Upload button above to add an update.
