This content originally appeared on DEV Community and was authored by erfankashani
Today I want to share an awesome library which I discovered recently. Creating diagrams for complicated software can be a time consuming and tricky if you are not using the right tool. Maintaining the diagram to show the most recent structure can be struggle. One of the most common go-to is diagram.net:

This web application allow users to drag and drop elements on a page and rename them to create variety of graphs. In my experience, this application can create really beautiful graphs which take a long Time to create.
My search was not done there. I aim to introduce speed in the diagram creations, version control, and easier interface than finding elements, resizing, and renaming them plenty of times. This is where I found Mermaid
This library is written in Javascript and allows diagram creation using a markdown like syntax. Mermaid can create the following diagrams:
- Flowchart
- Sequence diagram
- Class diagram
- State Diagram
- Entity Relationship diagram
- User journey
- Gantt
- Pie Chart
- Requirement diagram
Some of the benefits of using Mermaid.js:
- creating graphs as code
- saving time on styling the graphs
- version controlling your graphs
- easy integration with other libraries like diagram.net
To start we can install the “Markdown Preview Mermaid Support” extension on VSCode:
Then create a diagram directory in your desired codebase (optional). Finally create a markdown file like “app_diagram.md”. Choose the small (open preview to the side) icon on too right corner of your editor or ( shift + command + v for mac). Now you are ready to edit the file. Lets start with some easy examples:
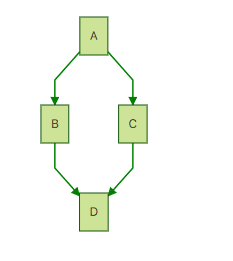
The following showcases a Flowchart using mermaid:
    graph TD;
            A-->B;
            A-->C;
            B-->D;
            C-->D;
Any mermaid code should be entered as a code snippet with “mermaid” tag. Each letter represents a node which are connected via edges.
There are many samples of diagram creation on the mermaid website. I am going to demonstrate a settup that worked for me while creating flowcharts:
<!-- ```mermaid
flowchart Guide
    direction TB
    f[flow]
    s[[Step]]
    i([input])
    d[(Database)]
    Parameters>Parameters]
``` -->
<!-- Resource: https://mermaid-js.github.io/mermaid/#/ -->
<!-- Look at the graph here: https://mermaid.live -->
<!-- Connect to diagrams.net: https://www.diagrams.net/blog/mermaid-diagrams -->

```mermaid
flowchart LR
    subgraph Guide
        direction TB

        f[flow]
        s[[Step]]
        d[(Database)]
        Parameters>Parameters]
    end

    %% add in-line style
    Guide:::someclass
    classDef someclass fill:#f96;


    %%list of parameters
    p1>bank_name]
    p2>seller_info]


    %%list of steps
    s1[[1-withdraw_money]]
    s2[[2-purchase_bike]]


    %%list of flows
    f1[go_to_bank]
    f2[withdraw_from_atm]
    f3[contact_seller]
    f4[trade_bike]


    %%list of databases
    d1[(reads: customer_identification)]
    d2[(reads/writes: customer_balance)]
    d3[(writes: e_document_sign)]


    %% Create the step flows
    s1-.->s2;


    %% s1 flow
    p1-->|inputs|s1
    s1-->|calls|f1
    f1-->|calls|f2
    f2-->d1
    f2-->d2


    %% s2 flow
    p2-->|inputs|s2
    s2-->f3
    f3-->f4
    f4-->d3
\```
There are also other resources where you can export your graphs as PNG or SVG like mermaid.live. Moreover, you can checkout this blog regarding how to transfer your graphs from mermaid to diagram.net (FYI, digram.net does not support all mermaid functionalities)
I hope you have enjoyed this tutorial. Feel free to express your comments.
Regards,
Erfan
This content originally appeared on DEV Community and was authored by erfankashani
erfankashani | Sciencx (2022-04-14T13:02:01+00:00) Awesome diagrams using Mermaid.js. Retrieved from https://www.scien.cx/2022/04/14/awesome-diagrams-using-mermaid-js/
Please log in to upload a file.
There are no updates yet.
Click the Upload button above to add an update.


