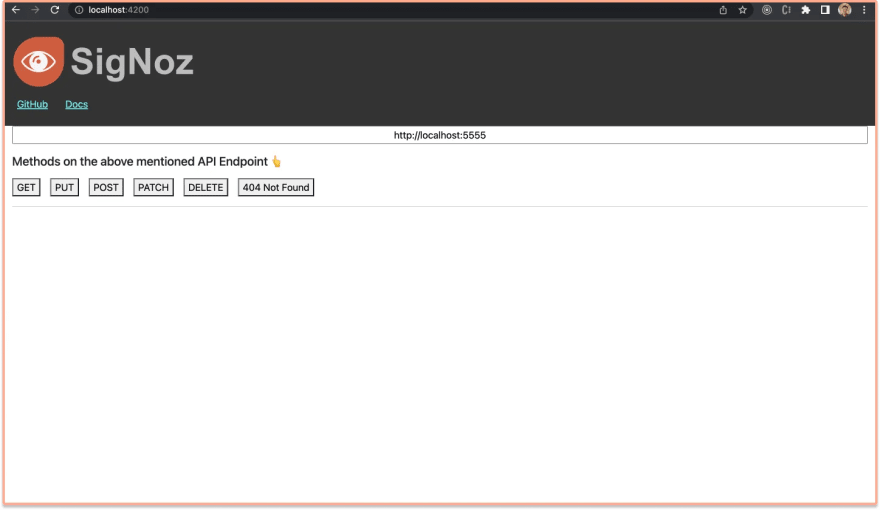
This content originally appeared on DEV Community and was authored by Ankit Anand ✨
OpenTelemetry can be used to trace Angular applications for performance issues and bugs. OpenTelemetry is an open-source project under the Cloud Native Computing Foundation (CNCF) that aims to standardize the generation and collection of telemetry data. Telemetry data includes logs, metrics, and traces.
Angular is a frontend Javascript framework that uses HTML and Typescript. It’s a popular framework used by many organizations for their frontend applications. For a user, frontend is the user’s first interaction point, and it is necessary to ensure that your Angular apps provide a perfect user experience.
Repository of Angular library to deploy OpenTelemetry in Angular application
Using OpenTelemetry Angular libraries, you can instrument your Angular apps to generate traces from your Angular app to your downstream services.
Before we demonstrate how to implement the OpenTelemetry libraries, let’s have a brief overview of OpenTelmetry.
What is OpenTelemetry?
OpenTelemetry is an open-source vendor-agnostic set of tools, APIs, and SDKs used to instrument applications to create and manage telemetry data(logs, metrics, and traces). It aims to make telemetry data(logs, metrics, and traces) a built-in feature of cloud-native software applications.
The telemetry data is then sent to an observability tool for storage and visualization.
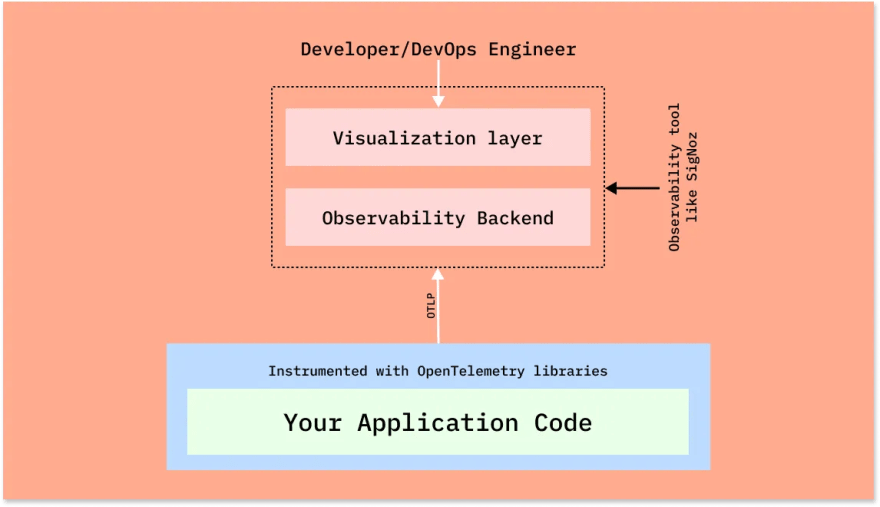 OpenTelemetry libraries instrument application code to generate telemetry data that is then sent to an observability tool for storage & visualization
OpenTelemetry is the bedrock for setting up an observability framework. It also provides you the freedom to choose a backend analysis tool of your choice.
OpenTelemetry and SigNoz
In this article, we will use SigNoz as our backend analysis tool. SigNoz is a full-stack open-source APM tool that can be used for storing and visualizing the telemetry data collected with OpenTelemetry. It is built natively on OpenTelemetry and supports OTLP data formats.
SigNoz provides query and visualization capabilities for the end-user and comes with out-of-box charts for application metrics and traces.
Now let’s get down to how to implement OpenTelemetry Angular libraries and then visualize the collected data in SigNoz.
Running Angular application with OpenTelemetry
Step 1: Install SigNoz
Frist, you need to install SigNoz so that OpenTelemetry can send the data to it.
SigNoz can be installed on macOS or Linux computers in just three steps by using a simple install script.
The install script automatically installs Docker Engine on Linux. However, on macOS, you must manually install Docker Engine before running the install script.
git clone -b main https://github.com/SigNoz/signoz.git
cd signoz/deploy/
./install.sh
You can visit our documentation for instructions on how to install SigNoz using Docker Swarm and Helm Charts.
When you are done installing SigNoz, you can access the UI at http://localhost:3301
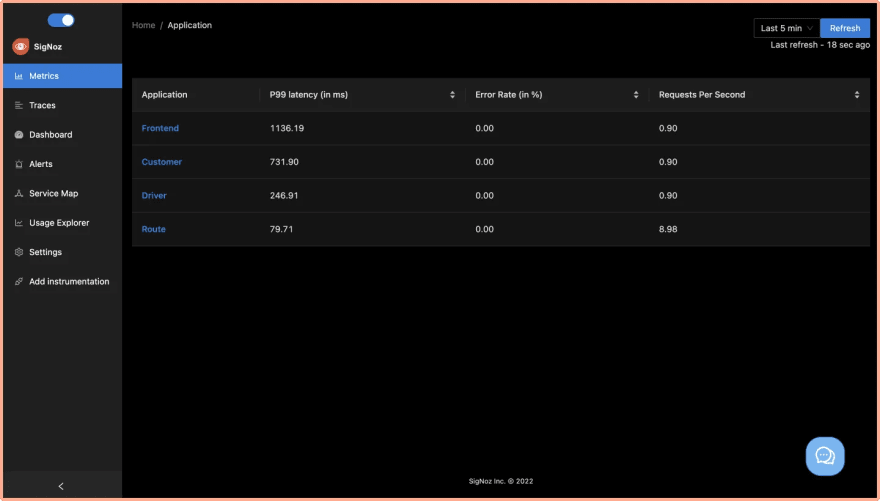 SigNoz dashboard - It shows services from a sample app that comes bundled with the application
Step 2: Get sample Angular app
We have set up two sample GitHub repos in order to demonstrate the example at hand
-
Sample Angular App
It contains the sample boilerplate code that we will instrument. If you want to follow the tutorial, then you should follow the
without instrumentationbranch. - Sample Nodejs App It contains a basic backend API which we will be calling. The backend API is also instrumented with OpenTelemetry to have end-to-end tracing.
Step 3: Enable CORS in the OTel Receiver
Enable CORS in the OTel Receiver. Under SigNoz folder, open the otel-collector-config.yaml file. The file is located at deploy/docker/clickhouse-setup/otel-collector-config.yaml
You can view the file at SigNoz GitHub repo. Inside the file add the following CORS config:
http:
+        cors:
+          allowed_origins:
+            - https://netflix.com  # URL of your Frontend application
You need to update the URL of your frontend application. For this tutorial, we will be running our frontend application on http://localhost:4200.
<img alt="">
Once you make the changes, you need to restart the Docker containers.
Step 4: Instrument Angular app with OpenTelemetry
To instrument the angular app with OpenTelemetry, we need to install the OpenTelemetry dependencies.
npm i @jufab/opentelemetry-angular-interceptor && npm i @opentelemetry/api @opentelemetry/sdk-trace-web @opentelemetry/sdk-trace-base @opentelemetry/core @opentelemetry/semantic-conventions @opentelemetry/resources @opentelemetry/exporter-trace-otlp-http @opentelemetry/exporter-zipkin @opentelemetry/propagator-b3 @opentelemetry/propagator-jaeger @opentelemetry/context-zone-peer-dep @opentelemetry/instrumentation @opentelemetry/instrumentation-document-load @opentelemetry/instrumentation-fetch @opentelemetry/instrumentation-xml-http-request @opentelemetry/propagator-aws-xray --save-dev
Step 5: Update app.module.ts file
import {
  OpenTelemetryInterceptorModule,
  OtelColExporterModule,
  CompositePropagatorModule,
} from '@jufab/opentelemetry-angular-interceptor';

@NgModule({
  ...
  imports: [
    ...
    OpenTelemetryInterceptorModule.forRoot({
      commonConfig: {
        console: true, // Display trace on console (only in DEV env)
        production: false, // Send Trace with BatchSpanProcessor (true) or SimpleSpanProcessor (false)
        serviceName: 'Angular Sample App', // Service name send in trace
        probabilitySampler: '1',
      },
      otelcolConfig: {
        url: 'http://127.0.0.1:4318/v1/traces', // URL of opentelemetry collector
      },
    }),
    //Insert OtelCol exporter module
    OtelColExporterModule,
    //Insert propagator module
    CompositePropagatorModule,
  ],
  ...
})
Make sure to update then URL of OpenTelemetry Collector under otelcolConfig. In our case since we’re running SigNoz in local, the URL is http://127.0.0.1:4318/v1/traces.
You can change the name of the service, and other configurations under commonConfig.
Step 6: Start the angular app and the backend API
For Angular app:
Go to the root folder of your Angular application, and run the following command:
yarn start
For backend API:
Install the dependencies
yarn install
If SigNoz is installed locally, run your backend API using:
yarn run start:local
If SigNoz is not installed locally, then you would need to set the IP of the machine where SigNoz is installed. You can do so by using the below command:
OTEL_EXPORTER_OTLP_ENDPOINT="<IP of SigNoz>:4317" OTEL_RESOURCE_ATTRIBUTES=service.name=NAME_OF_SERVICE yarn run start:custom```
Congratulations! You have successfully run your Angular application with OpenTelemetry. It’s time to see the collected data.
Step 7: Generate some data
In order to monitor your Angular application with SigNoz, you first need to generate some data.
Visit http://localhost:4200/ to access your frontend application. Using the UI, make some calls to the backend API. You can check the network tab in your browser to see the requests that you have made.
Step 8: Monitor your application with SigNoz
With SigNoz you can monitor the data collected by OpenTelemetry from your sample Angular application. You can see end-to-end traces for your Angular application, starting from your frontend application to the downstream nodejs-sample-app.
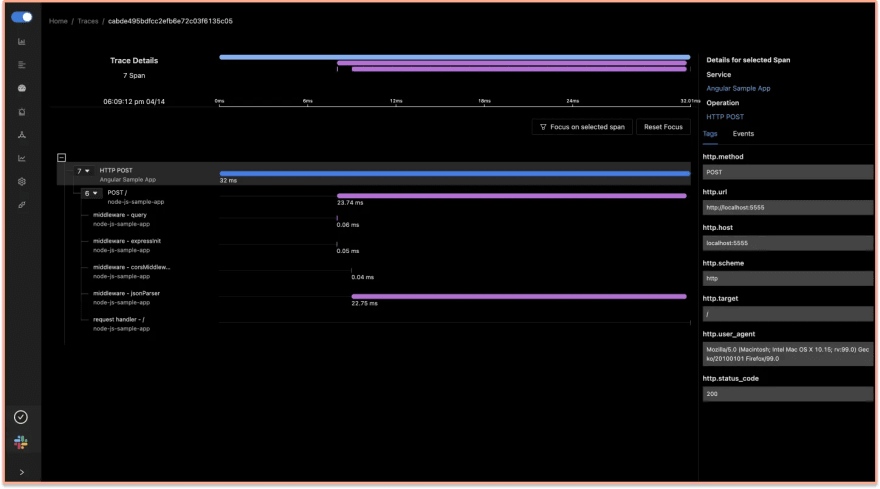 See end-to-end traces from your Angular application to downstream services
You can also monitor errors that takes place in your Angular application. SigNoz UI also shows attributes like http_status_code .
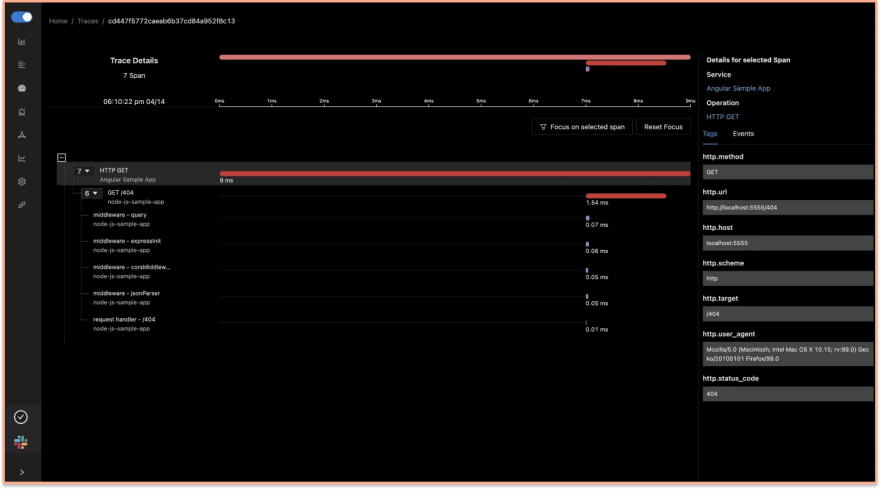 Monitor errors in your frontend Angular application
Conclusion
Using OpenTelemetry Angular libraries, you can instrument your frontend applications for end-to-end tracing. You can then use an open-source APM tool like SigNoz to ensure the smooth performance of your Angular apps.
OpenTelemetry is the future for setting up observability for cloud-native apps. It is backed by a huge community and covers a wide variety of technology and frameworks. Using OpenTelemetry, engineering teams can instrument polyglot and distributed applications with peace of mind.
SigNoz is an open-source observability tool that comes with a SaaS-like experience. You can try out SigNoz by visiting its GitHub repo 👇
If you are someone who understands more from video, then you can watch the our video tutorial on how to implement OpenTelemetry Angular libraries and monitor the application with SigNoz.
If you face any issues while trying out SigNoz, you can reach out with your questions in #support channel 👇
Further Reading
Monitor gRPC calls with OpenTelemetry
Distributed Tracing for a nodejs application
This content originally appeared on DEV Community and was authored by Ankit Anand ✨
Ankit Anand ✨ | Sciencx (2022-04-16T04:51:33+00:00) Implementing OpenTelemetry in Angular application. Retrieved from https://www.scien.cx/2022/04/16/implementing-opentelemetry-in-angular-application/
Please log in to upload a file.
There are no updates yet.
Click the Upload button above to add an update.


