Find Whether a Condition Impacts the Outcome with Statistical Certainty

The Breakdown of the Chi-Square Test

Last week I presented a fictional scenario where I was an analyst working with a data scientist. The stakeholders at my company wished to know where the best location was to open a new restaurant.

With most stakeholders, typically one statistical question elicits them to think of another. So let’s go with my fictional scenario, and as I am working with the data scientist to build predictive models finding where the best place to open a restaurant is, a stakeholder sends this email along:

Opening a restaurant outside of the U.S. costs much more. Based on our conversations, and what you’ve seen in the data so far, is there strong cause to focus our efforts outside of the U.S.?

Photo by Osman Rana on Unsplash

Let’s unpack this. The conversations you’ve been a part of, stakeholders believe the ratings of specific restaurants are key to a restaurant’s success. Using the ratings as our success factor, we wish to measure whether there is enough statistical evidence that the condition of a restaurant located in the U.S. is more favorable than any international company. Enter: the Chi Square Test.

What is the Chi-Square Test?

The Chi Square test is a statistical test that given a specific condition, will the expected outcome vary to a level of statistical significance in the instance said condition is present. This test compares the actual results from the expected results based on basic probability. In the instance of this test we wish to measure:

H0: The restaurant located in the United States is independent from whether a restaurant is favorably rated or not

Ha: The restaurant located in the United States is dependent from whether a restaurant is favorably rated or not

The first step to this test is splitting your dataset. I am using the Zomato dataset, and having seen many missing values from the aggregate ratings i am dropping these to normalize the dataset. I split the dataset by country code and map a histogram of each to determine normalcy.

import pandas as pd 
import numpy as np
import seaborn as sns
df=pd.read_csv('zomato.csv')
us=df[(df['Country Code]==216)]
us_histogram=sns.histplot(x='Aggregate rating', data=us)
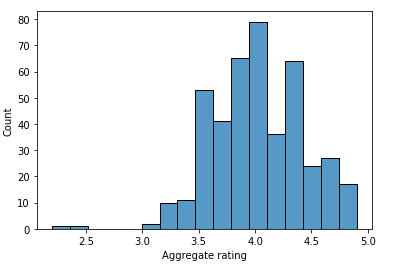
Histogram for US Aggregate Ratings
international=df.drop(df.index[df['Country Code'].isin([216])])
international_histogram=sns.histplot(x='Aggregate rating', data=international)
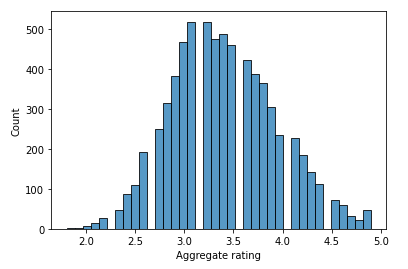
Histogram for International Aggregate Ratings

After removing the missing values, which skewed the data, we have split the data into two dataframes, one that includes only US Ratings and the other that includes all but US Ratings. From these histograms we can observe natural Bins or groupings with how the data is arranged. We take those groupings and create a new series within both dataframes that bins each of these rating groups into three categories.

conditions=[
(us['Aggregate rating']<2.7),
(us['Aggregate rating']>4.0),
(us['Aggregate rating']<4)]
values=['poor', 'fair', 'good']
us['rating bin']=np.select(conditions, values)
conditions=[
(international['Aggregate rating']<2.7),
(international['Aggregate rating']>4.0),
(international['Aggregate rating']<4)]
values=['poor', 'fair', 'good']
international['rating bin']=np.select(conditions, values)

Of these three categories we have now created by binning the ratings, we want to create a count of how many occurrences both inside and outside the US we have had ‘poor’, ‘fair’ and ‘good’ rated restaurants:

international_rating_count=(international['rating bin'].value_counts())

us_rating_count=(us['rating bin'].value_counts())

These two counts showed me that the fair, good and poor ratings for the US totaled 215,182 and 2 ratings, respectively. In addition, the value counts for international ratings showed that I had 899 fair ratings, 5350 good ratings and 485 poor ratings. I create a table that shows these results as Actual results.

arrays_ACTUAL=pd.DataFrame({'rating':['fair', 'good', 'poor'],
'United States':[215,182,2] ,
'International':[5350,899,485]})
arrays_ACTUAL.set_index(['rating'])
arrays_ACTUAL['rating total']=arrays_ACTUAL['United States']+arrays_ACTUAL['International']
arrays_ACTUAL.loc[len(arrays_ACTUAL.index)]=['column_total', 431,6968, 7133]
arrays_ACTUAL
Actual Aggregate Ratings for International & US Ratings

In the table above, I have used my good old TI-83 Calculator from 9th Grade to derive the column and row totals, as these values are imperative to the Chi Square test. Also within this test we wish to create probabilities for each scenario. The probabilities make up the Expected portion.

The next step is to calculate the Expected table. With creating this, we are using some materials that date back to earlier than my freshman algebra class. Python does not include an expected outcome package, and sometimes basics are best. For each tile in the Actual results we need to calculate the individual probability for each scenario.
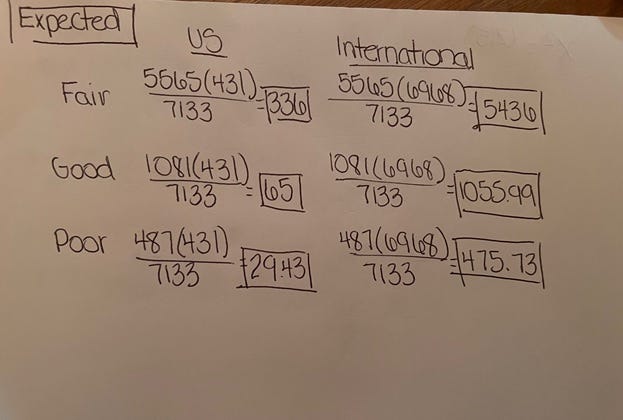
Hand Calculation Probabilities for Each Expected Outcome

As an example, to calculate the Probability that a rating is Fair and US=

((Total of US & Fair Ratings)*(Total Number of Fair Ratings))/Total Number of Ratings.

In this case the 431 US Based Fair Ratings were multiplied by the 5565 fair ratings in both datasets. This Multiplied number was divided by the total number of ratings, which is 7133. This brings us our Expected Rating Count of 336.26. From these calculations we can build the following table of Expected Ratings:

arrays_EXPECTED=pd.DataFrame({'rating':['fair', 'good', 'poor'],
'United States':[336,65,29] ,
'International':[5436,1056,475]})
arrays_EXPECTED.set_index(['rating'])
arrays_EXPECTED['rating total']=arrays_EXPECTED['United States']+arrays_EXPECTED['International']
arrays_EXPECTED.loc[len(arrays_EXPECTED.index)]=['column_total', 431,6968, 7133]
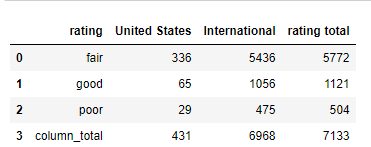
Expected Aggregate Ratings for International and US

To find the Chi Square, we must sum the following for each scenario:

X²=∑(Actual-Expected)²/Expected

And the degrees of freedom, which are

degrees of freedom=(CountofRows-1)(CountofColumns-1)

Our calculations are seen below:

Chi-Test/ X² Calc: Expected versus Actual Observations of Aggregate Ratings for Restaurants US vs Int’l

We have a Chi Test Value of 303 and two degrees of freedom. The p value of this test determines the confidence we have in the difference between the two sets of values. For our final step we use python again to derive the p value.

from scipy import stats
1-stats.chi2.cdf(303,2)

I personally don’t like the python method of finding the p-value, and in fact I originally used the table in the appendix section of my textbook from Stat 500 at Penn State to come up with the p-value. As a reference the table I used aligns with the values in this table.

In statistics for business it is just as important to use a method you can defend, as it is to explain your conclusions correctly. I finished grad school from Penn State less than 3 years ago. Much of what I learned in Stats 501, 502 and 503 were hand calculated. This allowed me to truly comprehend the decisions I was making with the statistics I understood.

But back to my whole fictional story of why the question was being asked in the first place. Here’s how I’d respond to the email.

You ask a great question. Based on conversations, I’ve used ratings as the deciding factor as to whether a restaurant is more favorable in the US vs. Internationally. When I drew a visual of how the International Ratings were distributed versus the US you can see :

Here we can see the majority of the US Aggregate Ratings are overall higher than the International Aggregate Ratings. This information gave me the grounds to run a statistical test. I wanted to understand whether a the US Based Restaurant was higher rated with statistical significance. I ran what’s called the Chi Squared Test. This test uses basic probability to compare the two groups results. From this test, I found beyond reasonable doubt that US based restaurants were overall more favorably rated than their international counterparts.

Based on these findings I would recommend we focus our search on US locations.

Reference:

8.1 — The Chi-Square Test of Independence | STAT 500 (psu.edu)

EDA-Zomato/Zomato EDA at main · Adesh2021/EDA-Zomato (github.com)

Applied Linear Statistical Models, Michael H. Kutner, International Edition, 2005. McGraw-Hill Publishing, Inc.


Find Whether a Condition Impacts the Outcome with Statistical Certainty was originally published in Level Up Coding on Medium, where people are continuing the conversation by highlighting and responding to this story.


This content originally appeared on Level Up Coding - Medium and was authored by Kat Hernandez


Print Share Comment Cite Upload Translate Updates
APA

Kat Hernandez | Sciencx (2022-06-13T22:20:08+00:00) Find Whether a Condition Impacts the Outcome with Statistical Certainty. Retrieved from https://www.scien.cx/2022/06/13/find-whether-a-condition-impacts-the-outcome-with-statistical-certainty/

MLA
" » Find Whether a Condition Impacts the Outcome with Statistical Certainty." Kat Hernandez | Sciencx - Monday June 13, 2022, https://www.scien.cx/2022/06/13/find-whether-a-condition-impacts-the-outcome-with-statistical-certainty/
HARVARD
Kat Hernandez | Sciencx Monday June 13, 2022 » Find Whether a Condition Impacts the Outcome with Statistical Certainty., viewed ,<https://www.scien.cx/2022/06/13/find-whether-a-condition-impacts-the-outcome-with-statistical-certainty/>
VANCOUVER
Kat Hernandez | Sciencx - » Find Whether a Condition Impacts the Outcome with Statistical Certainty. [Internet]. [Accessed ]. Available from: https://www.scien.cx/2022/06/13/find-whether-a-condition-impacts-the-outcome-with-statistical-certainty/
CHICAGO
" » Find Whether a Condition Impacts the Outcome with Statistical Certainty." Kat Hernandez | Sciencx - Accessed . https://www.scien.cx/2022/06/13/find-whether-a-condition-impacts-the-outcome-with-statistical-certainty/
IEEE
" » Find Whether a Condition Impacts the Outcome with Statistical Certainty." Kat Hernandez | Sciencx [Online]. Available: https://www.scien.cx/2022/06/13/find-whether-a-condition-impacts-the-outcome-with-statistical-certainty/. [Accessed: ]
rf:citation
» Find Whether a Condition Impacts the Outcome with Statistical Certainty | Kat Hernandez | Sciencx | https://www.scien.cx/2022/06/13/find-whether-a-condition-impacts-the-outcome-with-statistical-certainty/ |

Please log in to upload a file.


There are no updates yet.
Click the Upload button above to add an update.

You must be logged in to translate posts. Please log in or register.