This content originally appeared on DEV Community and was authored by Ankit Anand ✨
Nodejs tops the list of most widely used frameworks for server-side programming by developers. Powered by Google’s V8 engine, its performance is incredible. As a result, Nodejs has now become a critical part of the technology stack of large-scale enterprises and startups. And as nodejs is based on Javascript, it is also easier to learn and begin with.
Nodejs is a dynamically typed single-threaded programming language. There is a lot of freedom for the interpreter and runtime to make decisions that can easily lead to memory leaks and high CPU loads. As such, monitoring your nodejs application for performance issues is important.
But it’s not enough to monitor your nodejs web servers only. You need to monitor your entire application stack for robust application performance. In this tutorial, the sample application that we will monitor is built using the MEVN stack.
Learn how to build a CRUD application using Vue 3, Node, Express, and MongoDB.
Complete MEVN stack tutorial
Nodejs performance monitoring is essential to maintain and improve the application’s performance to meet increasing users’ expectations. When a user clicks on an application’s interface, the request travels from the frontend to the web servers initiating any database calls if required.
In this tutorial, we will use OpenTelemetry and SigNoz to monitor a full-stack application. The sample app is built using these four components:
- Vue 3
- Express
- Nodejs
- MongoDB
Using OpenTelemetry and SigNoz, you can trace a user request end-to-end from the frontend to the web servers, including the database calls. Before we demonstrate how to do this with OpenTelemetry and SigNoz, let’s learn a bit about them.
OpenTelemetry and SigNoz
OpenTelemetry is a vendor-agnostic set of tools, APIs, and SDKs used to instrument applications to create and manage telemetry data(logs, metrics, and traces). It aims to make telemetry data a built-in feature of cloud-native software applications.
OpenTelemetry provides the instrumentation layer to generate and export your telemetry data to a backend. Then, you need to choose a backend tool that will provide the data storage and visualization for your telemetry data. That’s where SigNoz comes into the picture.
SigNoz is a full-stack open-source APM tool that provides metrics monitoring and distributed tracing.
OpenTelemetry is the way forward for cloud-native application owners who want to set up a robust observability framework. It also provides you the freedom to choose any backend analysis tool. SigNoz is built to support OpenTelemetry natively, thus making a great combo.
Nodejs Performance monitoring with OpenTelemetry and SigNoz
To monitor the nodejs application for performance issues, we need good telemetry data. Telemetry data can be anything that tells us how the application is performing while processing user requests. Once we have that telemetry data, it needs to be visualized for actionable insights.
OpenTelemetry helps you to generate telemetry data, as mentioned before. And SigNoz helps to store, visualize and run queries on the data. Together, OpenTelemetry and SigNoz make a great combo to monitor nodejs applications for performance issues.
The first step is to instrument your application with OpenTelemetry client libraries. Instrumentation is the process of enabling your application code to generate telemetry data.
We will divide the tutorial into two parts:
- Instrumenting the sample nodejs app
- Instrumenting the frontend application made with Vuejs
- Instrumenting node/express server
- Instrumenting MongoDB database calls
- Monitor nodejs performance with SigNoz dashboards
Installing SigNoz
First of all, you need to install SigNoz. OpenTelemetry does not provide any storage capabilities, so you need to export the data to SigNoz backend once it is collected through OpenTelemetry.
SigNoz can be installed on macOS or Linux computers in just three steps by using a simple installation script.
The install script automatically installs Docker Engine on Linux. However, on macOS, you must manually install Docker Engine before running the install script.
git clone -b main https://github.com/SigNoz/signoz.git
cd signoz/deploy/
./install.sh
You can visit our documentation for instructions on how to install SigNoz using Docker Swarm and Helm Charts.
When you are done installing SigNoz, you can access the UI at http://localhost:3301
 SigNoz dashboard - It shows services from a sample app that comes bundled with the application
Instrumenting the full-stack application with OpenTelemetry
In this section, we will be monitoring the API calls made from the frontend Vuejs application through the express and nodejs server and finally to Mongodb with OpenTelemetry.
You can find the application code instrumented with OpenTelemetry and ready to be monitored with SigNoz here. Get it to your local by cloning the GitHub repo:
git clone https://github.com/SigNoz/mevn-opentelemetry-example.git
In the sample app repo, the SigNoz folder is also included. You can keep your SigNoz folder anywhere you want. The section below explains how to go about setting up the MEVN application for monitoring.
Note: The GitHub sample app is already instrumented with OpenTelemetry.
Frontend monitoring set up
Get into /client application and install the OpenTelemetry dependencies by running the following command:
npm i @opentelemetry/api @opentelemetry/sdk-trace-web @opentelemetry/resources @opentelemetry/sdk-trace-base @opentelemetry/exporter-collector @opentelemetry/context-zone @opentelemetry/instrumentation-fetch @opentelemetry/instrumentation
Now create a file called tracing.js in the /src folder, and in that file, we will be adding the required setup to enable frontend tracing.
Paste the following code in src/tracing.js file:
import { context, trace, SpanStatusCode } from "@opentelemetry/api";
import { WebTracerProvider } from "@opentelemetry/sdk-trace-web";
import { Resource } from "@opentelemetry/resources";
import { SimpleSpanProcessor } from "@opentelemetry/sdk-trace-base";
import { CollectorTraceExporter } from "@opentelemetry/exporter-collector";
import { ZoneContextManager } from "@opentelemetry/context-zone";
import { FetchInstrumentation } from "@opentelemetry/instrumentation-fetch";
import { registerInstrumentations } from "@opentelemetry/instrumentation";

const serviceName = "link-frontend"; //remember this service name

const resource = new Resource({ "service.name": serviceName });
const provider = new WebTracerProvider({ resource });

const collector = new CollectorTraceExporter({
    url: "http://localhost:4318/v1/traces",
});

provider.addSpanProcessor(new SimpleSpanProcessor(collector));
provider.register({ contextManager: new ZoneContextManager() });

const webTracerWithZone = provider.getTracer(serviceName);

var bindingSpan;

window.startBindingSpan = (
    traceId,
    spanId,
    traceFlags,
) => {
    bindingSpan = webTracerWithZone.startSpan("");
    bindingSpan.spanContext().traceId = traceId;
    bindingSpan.spanContext().spanId = spanId;
    bindingSpan.spanContext().traceFlags = traceFlags;
};

registerInstrumentations({
    instrumentations: [
        new FetchInstrumentation({
            propagateTraceHeaderCorsUrls: ["/.*/g"],
            clearTimingResources: true,
            applyCustomAttributesOnSpan: (
                span,
                request,
                result,
            ) => {
                const attributes = span.attributes;
                if (attributes.component === "fetch") {
                    span.updateName(
                        `${attributes["http.method"]} ${attributes["http.url"]}`
                    );
                }
                if (result instanceof Error) {
                    span.setStatus({
                        code: SpanStatusCode.ERROR,
                        message: result.message,
                    });
                    span.recordException(result.stack || result.name);
                }
            },
        }),
    ],
});

// This is the function that we will be using to trace function calls
export function traceSpan(
    name,
    func
) {
    var singleSpan;
    if (bindingSpan) {
        const ctx = trace.setSpan(context.active(), bindingSpan);
        singleSpan = webTracerWithZone.startSpan(name, undefined, ctx);
        bindingSpan = undefined;
    } else {
        singleSpan = webTracerWithZone.startSpan(name);
    }
    return context.with(trace.setSpan(context.active(), singleSpan), () => {
        try {
            const result = func();
            singleSpan.end();
            return result;
        } catch (error) {
            singleSpan.setStatus({ code: SpanStatusCode.ERROR });
            singleSpan.end();
            throw error;
        }
    });
}
Now import the traceSpan function from the src/tracing.js file and use it with the functions that you're using to make API calls.
Inside the <script> section in App.vue
import { traceSpan } from "./tracing";
.
.
.
methods: {
    async addTodo() {
      const response = await axios.post("api/todoList/", {
        title: this.title,
        description: this.description
      });
      this.todos.push(response.data);
      this.title = "";
      this.description = "";
    },
    async removeTodo(item, i) {
      await axios.delete("api/todoList/" + item._id);
      this.todos.splice(i, 1);
    },

    // these are the functions that we're going to use to add and remove todo
    async handleAddTodo(e){
        e.preventDefault();
        await traceSpan("addTodo", this.addTodo);
   },
    async handleRemoveTodo(todo, i){
      await traceSpan("removeTodo", this.removeTodo(todo, i));
    }
  }
Inside the <template> section in App.vue, remove addTodo() & removeTodo and use handleAddTodo() & handleRemoveTodo():
<template>
 <div class="main">
  <h3>Todo List</h3>

  <form class="form" >
    <input class="input" v-model="title" type="text" name="name" placeholder="Enter Todo" />
    <br />
    <input class="input" v-model="description" type="text" name="description"  placeholder="Enter Description" />
    <br />
    <button class="submit-button" @click="handleAddTodo">Add Todo</button>
  </form>
  <div class="todo-container">
    <ul>
      <li v-for="(todo, i) in todos" :key="todo._id">
        <div class="todo">
        <span class="todo-name">{{ todo.title }}</span>
        <span class="todo-description">{{ todo.description }}</span>
      </div>
        <button class="delete-btn" @click="handleRemoveTodo(todo, i)">DELETE TODO</button>
      </li>
    </ul>
  </div>
  </div>
</template>
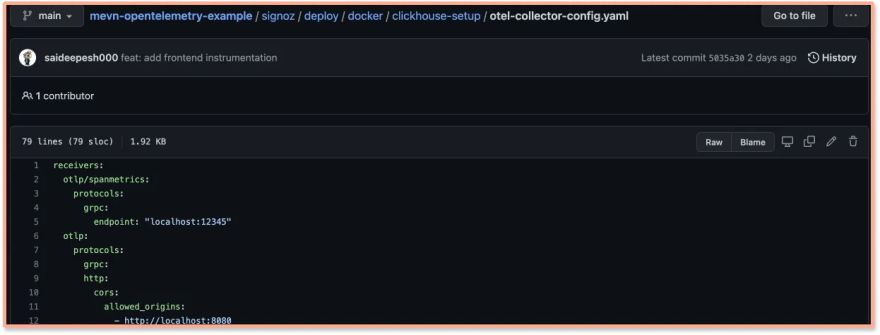
Now, enable CORS in the OpenTelemetry Receiver.Under SigNoz folder, open the otel-collector-config.yaml file. The file is located at deploy/docker/clickhouse-setup/otel-collector-config.yaml
You can view the file at SigNoz GitHub repo. Inside the file add the following CORS config:
http:
  cors:
    allowed_origins:
      - https://netflix.com  # URL of your Frontend application
Update the URL in the config file to match your frontend application URL. For this tutorial, we will be running our frontend application on http://localhost:8080.
http:
  cors:
    allowed_origins:
      - http://localhost:8080
Here’s a snapshot from the GitHub repo. You can find the file here.
After adding the changes, you need to restart the SigNoz Docker containers.
To stop the running SigNoz cluster:
- x86 -
sudo docker-compose -f docker/clickhouse-setup/docker-compose.yaml stop - Apple M1 -
sudo docker-compose -f docker/clickhouse-setup/docker-compose.arm.yaml stop
To start/resume the running SigNoz cluster:
- x86 -
sudo docker-compose -f docker/clickhouse-setup/docker-compose.yaml start - Apple M1 -
sudo docker-compose -f docker/clickhouse-setup/docker-compose.arm.yaml start
*Note: The stopped SigNoz cluster should resume and mount to the existing docker volumes.
And congratulations, your frontend application made with Vuejs is now instrumented with OpenTelemetry.
Backend monitoring setup
Now, get into /server and follow the below steps
Step1: Install OpenTelemetry packages:
npm install --save @opentelemetry/api
npm install --save @opentelemetry/sdk-node
npm install --save @opentelemetry/auto-instrumentations-node
npm install --save @opentelemetry/exporter-otlp-grpc
Step 2: Create tracing.js file
Instantiate tracing by creating a tracing.js file and using the below code:
// tracing.js
'use strict'
const process = require('process');
const opentelemetry = require('@opentelemetry/sdk-node');
const { getNodeAutoInstrumentations } = require('@opentelemetry/auto-instrumentations-node');
const { OTLPTraceExporter } = require('@opentelemetry/exporter-otlp-grpc');
// configure the SDK to export telemetry data to the console
// enable all auto-instrumentations from the meta package
const traceExporter = new OTLPTraceExporter();
const sdk = new opentelemetry.NodeSDK({
  traceExporter,
  instrumentations: [getNodeAutoInstrumentations()]
  });

  // initialize the SDK and register with the OpenTelemetry API
  // this enables the API to record telemetry
  sdk.start()
  .then(() => console.log('Tracing initialized'))
  .catch((error) => console.log('Error initializing tracing', error));

  // gracefully shut down the SDK on process exit
  process.on('SIGTERM', () => {
    sdk.shutdown()
    .then(() => console.log('Tracing terminated'))
    .catch((error) => console.log('Error terminating tracing', error))
    .finally(() => process.exit(0));
    });
Pass the necessary environment variable
Once the file is created, you only need to run one last command at your terminal, which passes the necessary environment variables. Here, you also set SigNoz as your backend analysis tool.
export OTEL_EXPORTER_OTLP_ENDPOINT="<IP of SigNoz>:4317"
export OTEL_RESOURCE_ATTRIBUTES=service.name=<service_name> \
Replacing the placeholders in the above command for localhost:
IP of SigNoz Backend: localhost (since we are running SigNoz on our localhost).
service_name: mevn-signoz (you can give whatever name that suits you)
So the final command is:
export OTEL_EXPORTER_OTLP_ENDPOINT="http://localhost:4317"
export OTEL_RESOURCE_ATTRIBUTES=service.name=mevn-signoz
Change the scripts of package.json on server to initiate tracing of the API calls:
//server/package.json
"scripts": {
    "start:server": "node -r ./tracing.js index.js",
    "start:client": "npm run serve --prefix '../client/'",
    "dev": "concurrently \"npm run start:server\" \"npm run start:client\""
  },
Now run both client & server:
npm run dev
Now, the client should be running on http://localhost:8080 while the server
runs on http://localhost:3000
Interact with the application a bit to generate some dummy data, and wait for the application to be visible on the SigNoz dashboard.
Below we can find the mevn-signoz in the list of applications being monitored.
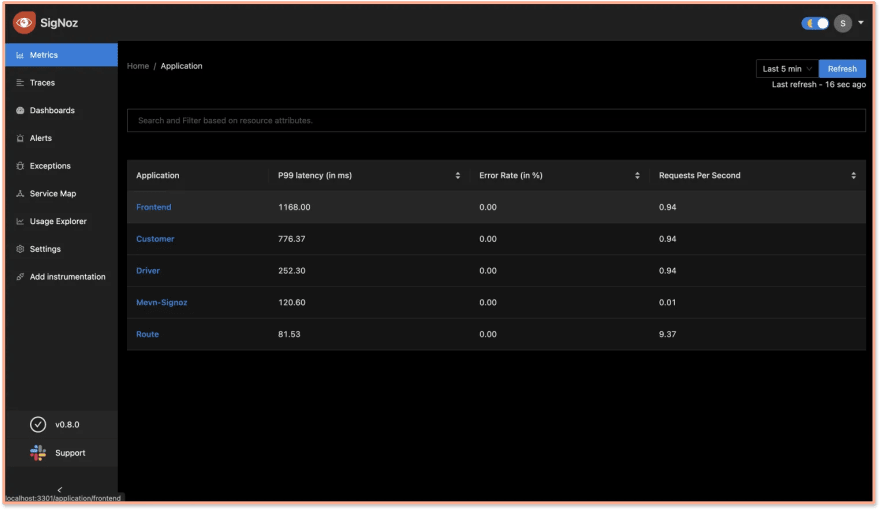 MEVN Example Application on SigNoz
Monitor full-stack Nodejs application performance with SigNoz
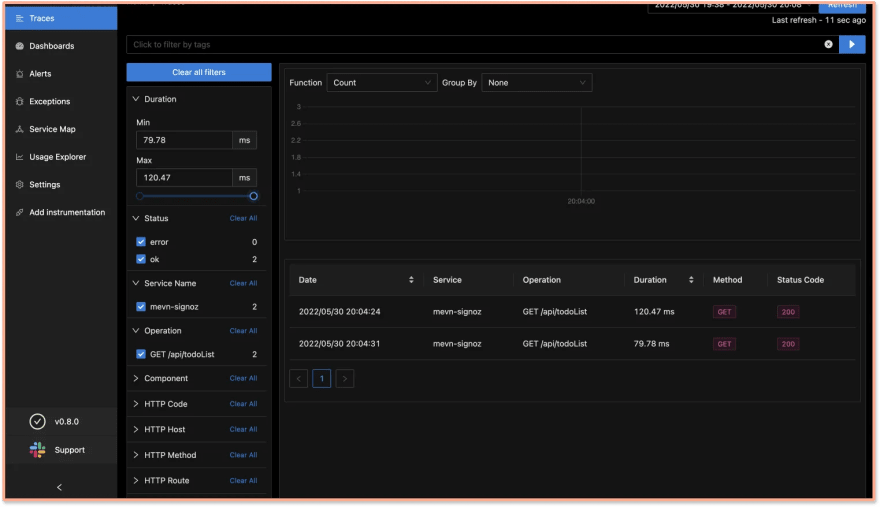
You can monitor calls from your frontend application under the Traces tab of SigNoz.
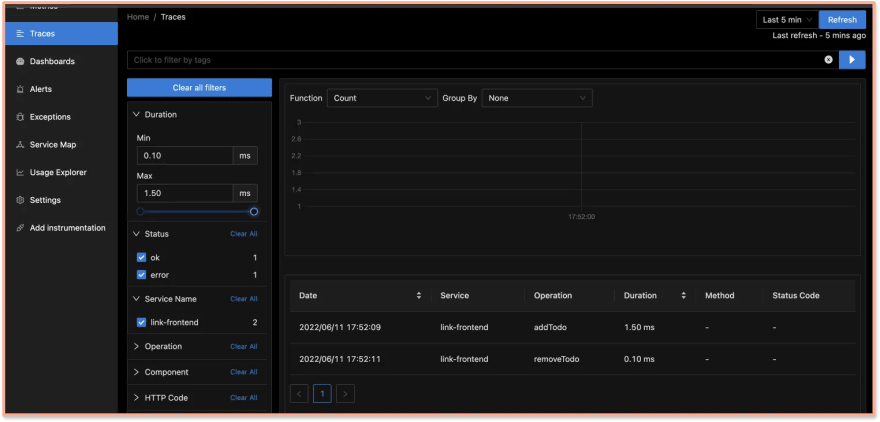 Function calls from frontend being monitored on SigNoz
SigNoz comes with out-of-box charts for monitoring application metrics. You can monitor key application metrics like application latency, requests per second, error rate, etc. You can also see the list of top endpoints from your application.
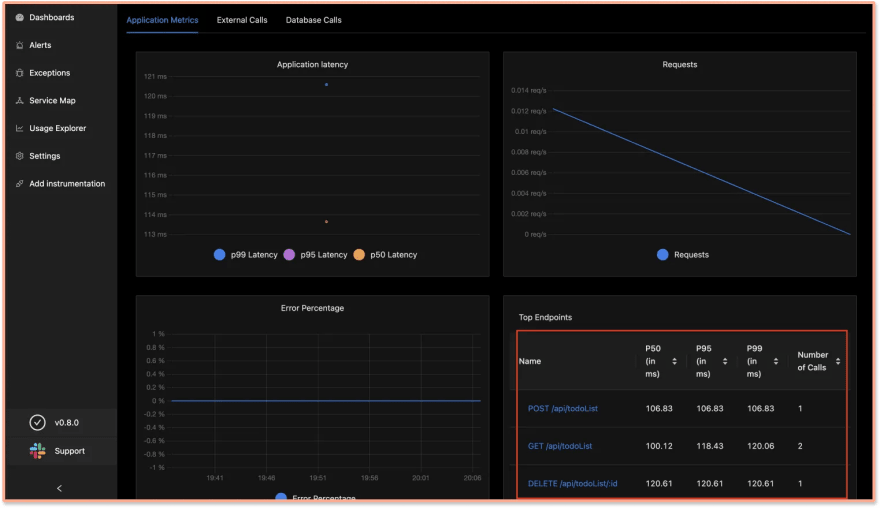 Monitor application metrics like latency, requests per second, error percentage, etc. with out-of-box charts
The Traces tab of SigNoz helps you analyze the tracing data collected from your nodejs application. SigNoz also lets you correlate your metrics with traces. If you want to investigate metrics of a particular endpoint, you can click on it to see the traces captured for it.
 Traces of the /GET endpoint for one of the requests
SigNoz provides Flamegraphs and Gantt charts to visualize the complete journey of user requests or transactions.
 Flamegraphs and Gantt charts on SigNoz dashboard help you visualize the complete journey of a user request
SigNoz helps you trace database calls too. In the flamegraphs, you can see the calls made to the MongoDB database in the sample app.
 Trace Mongodb database calls with SigNoz
Conclusion
Nodejs performance monitoring can enable engineering teams to take the right action while troubleshooting performance issues. With SigNoz and OpenTelemetry, you can set up performance monitoring for a full-stack application using nodejs as the server-side language.
SigNoz provides distributed tracing, using which you can trace transactions from the frontend application to web servers along with database calls. This type of visibility is required to debug performance issues in modern applications that use distributed architectures like microservices-based architecture or serverless.
OpenTelemetry makes it very convenient to instrument a full-stack application. Moreover, openTelemetry supports a wide range of web frameworks and programming languages. It is backed by Cloud Native Computing Foundation, the same foundation that incubated Kubernetes.
If you try out SigNoz to instrument your nodejs application and face any issues, feel free to ping us in the #support channel.
Further Reading
Implementing OpenTelemerty in an Angular application
Tracing MongoDB calls with OpenTelemetry
This content originally appeared on DEV Community and was authored by Ankit Anand ✨
Ankit Anand ✨ | Sciencx (2022-06-24T11:28:51+00:00) Monitoring a full-stack Nodejs application with open-source tools. Retrieved from https://www.scien.cx/2022/06/24/monitoring-a-full-stack-nodejs-application-with-open-source-tools/
Please log in to upload a file.
There are no updates yet.
Click the Upload button above to add an update.


