This content originally appeared on Level Up Coding - Medium and was authored by Anshita Bhasin

Sometimes you come across websites where you are unable to inspect the elements due to several reasons. The moment you select the element, it disappears and you are unable to find the locator.
However, when you need to debug JavaScript, Chrome Developer lets you pause when a DOM element changes and lets you even monitor its attributes.
In this blog, we will see multiple ways to inspect disappearing elements in DOM.
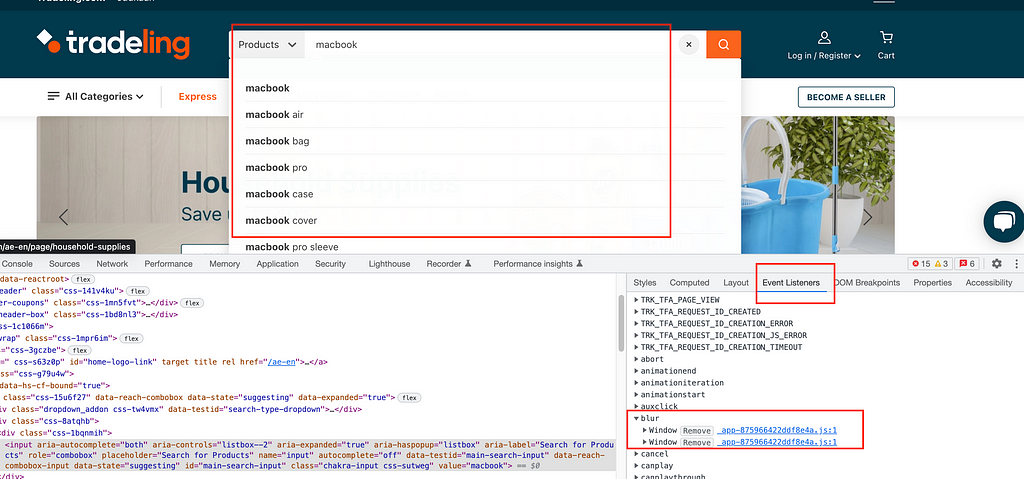
1. Events Listeners: Removing the blur property
a. Select Chrome Dev Tools, Go to Elements
b. Select the Event Listeners Tab (From Right Side)
c. Select blur. Expand the blur option
d. Click on remove for all the available properties.
Now, the elements won’t disappear from the dropdown and you would be able to inspect them.
2. Emulate a focused page
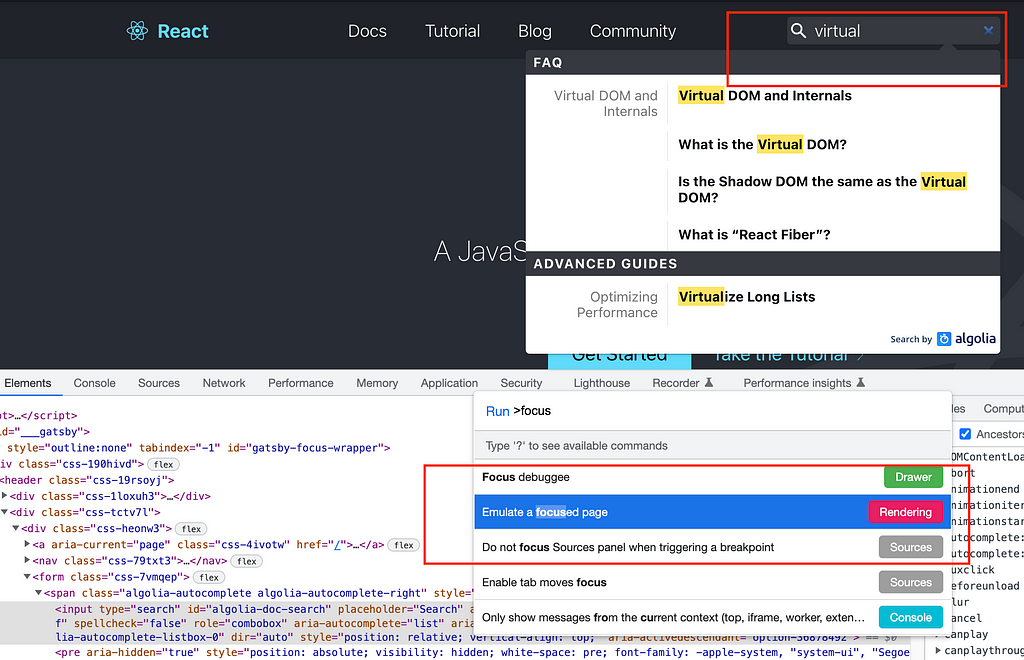
In some of the applications, we do not have blur property. So, by following the below approach you can inspect the hidden element.
a. Open chrome dev tools, click command+shift+p then type focus.
b. Click on “Emulate a focused page”.
Now, the hidden elements will not disappear on the page and you would be able to inspect the elements on the web application.
3. Command: Fn+F8 or cmd+\
You can also pause the DOM elements by using the keys → fn+F8 (or Ctrl+/).
It freezes the DOM and then you can inspect the elements on the page.
4. Source: Snippets
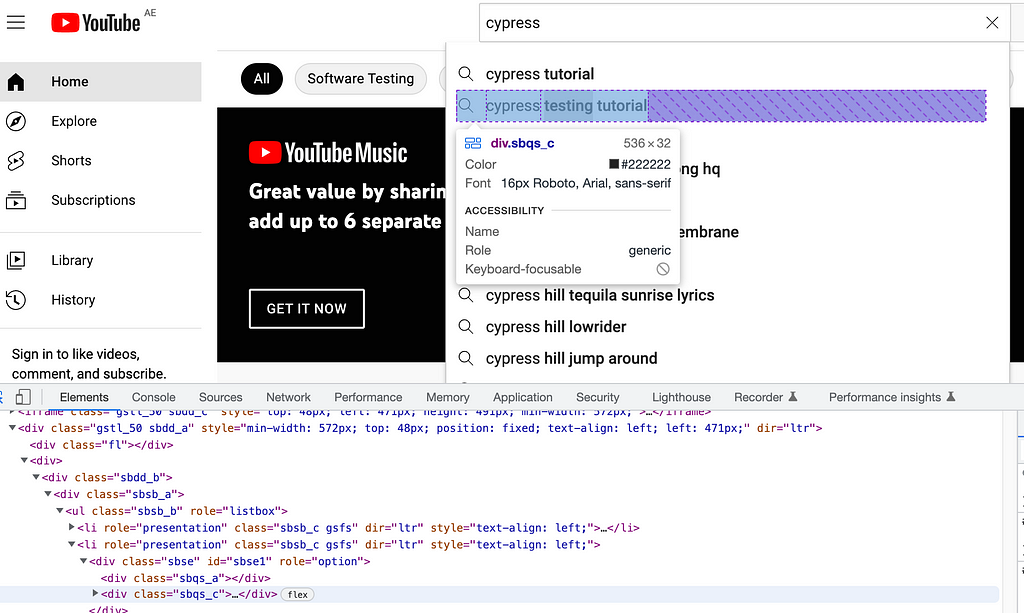
This is also one of the ways to locate the auto-suggestion/ hidden dropdown values.
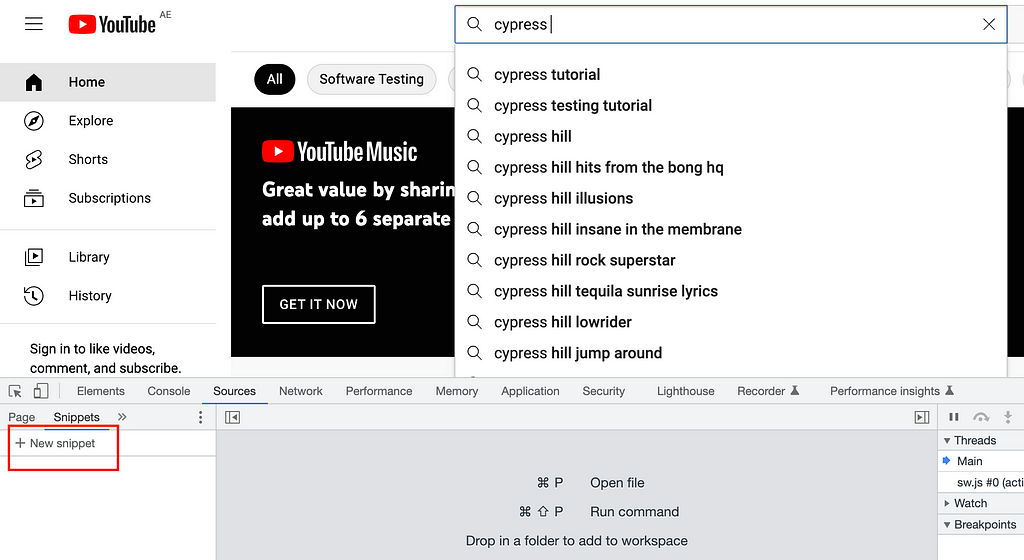
a. Go to Dev Tools, and select the “Sources” tab.
b. Select snippet
Tip: Click on >> to move to the right if you don’t see a snippet on the screen
c. Click on New Snippet
d. Go to Script Snippet (right side section) and enter “debugger;”
c. Now, Right-click on the Script snippet and select Run (Just as shown in the below screenshot).
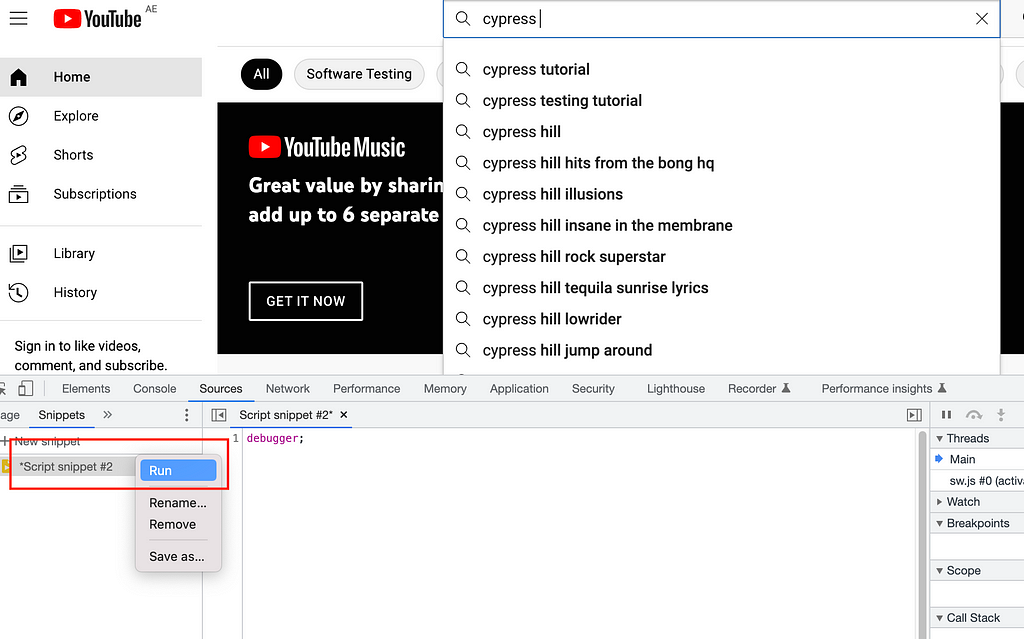
It will also help you inspect the elements on the page
5. Console: Script
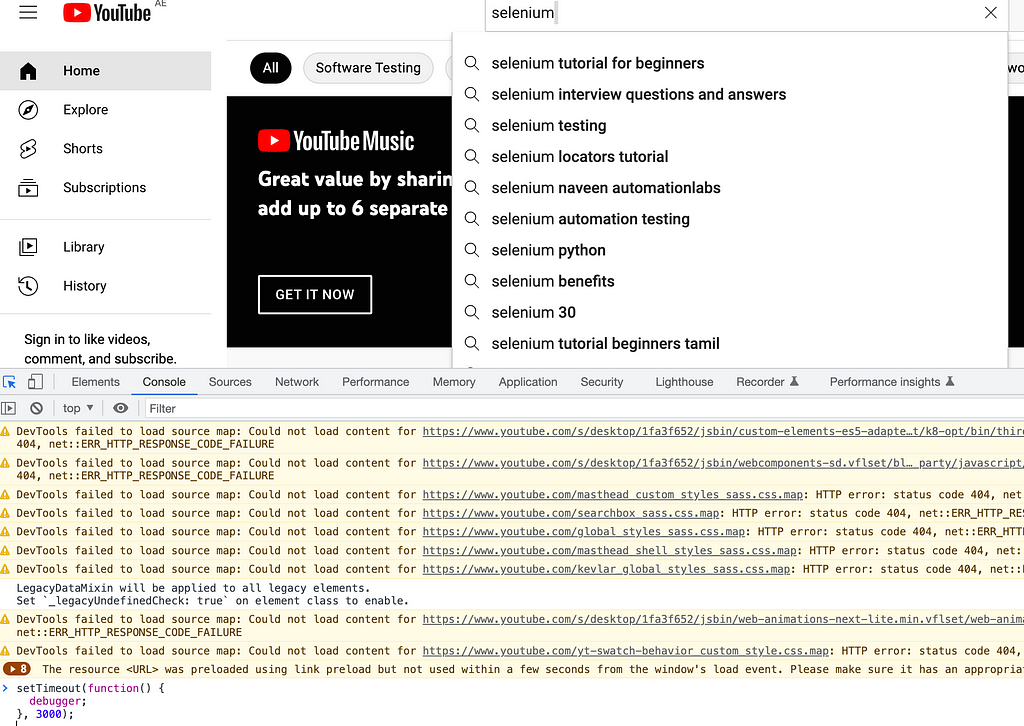
a. Open the console tab in Developer Tools
b. Enter the below command, It will freeze the execution and show “paused in debugger”
setTimeout(function() {
debugger;
}, 3000);
6. Break On :
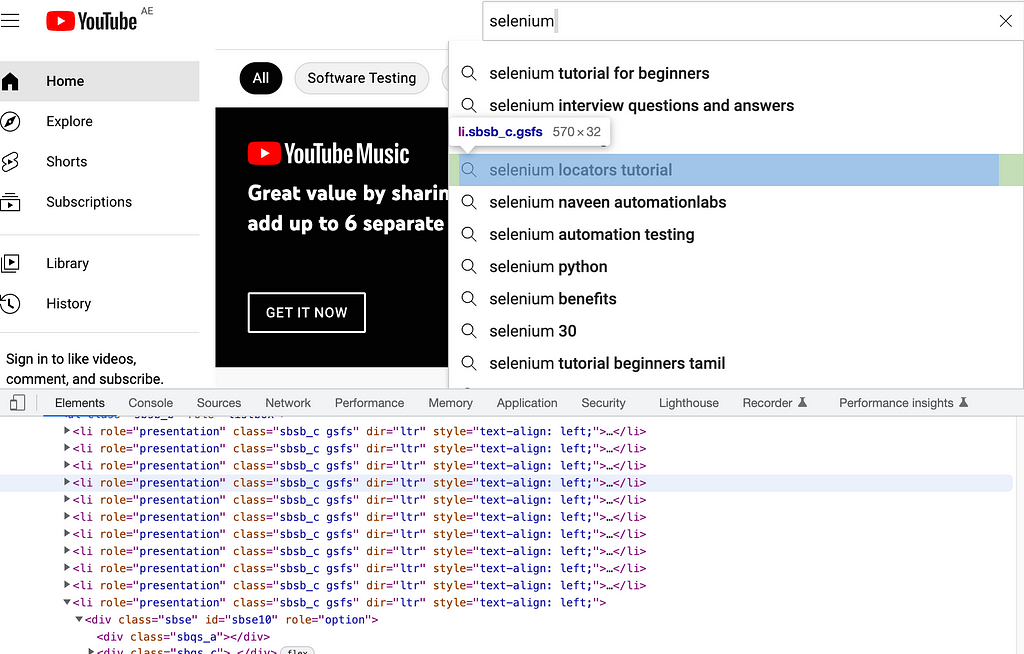
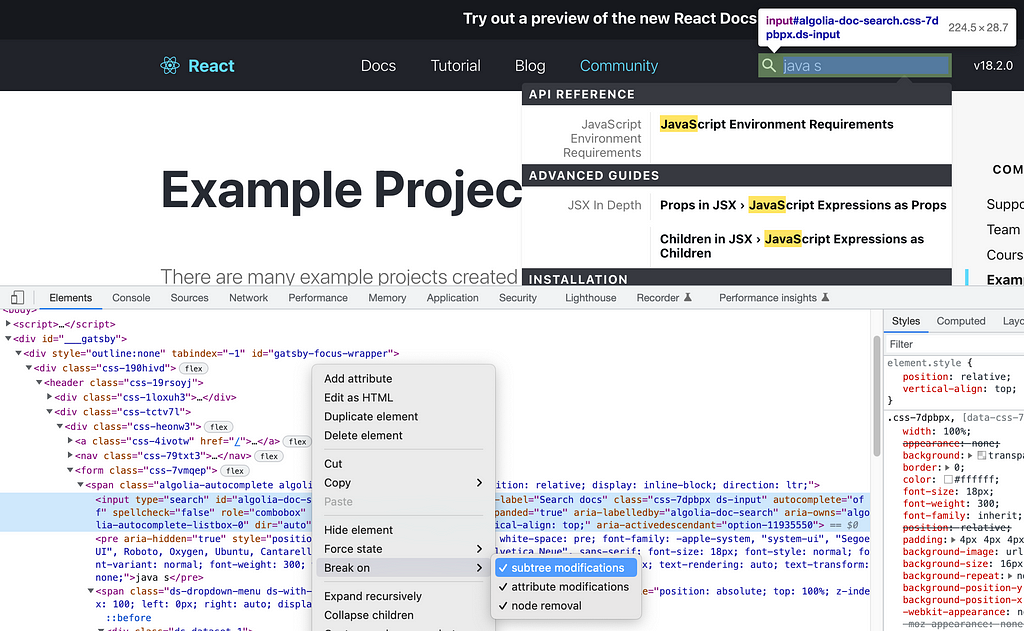
You can pause the DOM element by applying Break-On with Subtree Modifications.
a. Go to Dev Tools
b. Go to the element that you want to set the breakpoint on.
c. Right-click on the element
b. From the Dom, right-click on the element and select Break on, and select all the attributes ( Just as shown in the below screenshot).
Now, you would be able to inspect the elements on the page
Conclusion:
In this blog, we saw multiple ways to inspect the auto-suggestion/ hidden dropdown values in DOM. There are 6 different approaches shared. Sometimes, the pause debugger doesn’t work but removing the blur options work. I hope, it helps you inspect disappearing elements on the web application.
Thanks for reading. Happy Learning! — AB
Ref : Naveen AutomationLabs ( https://youtu.be/SS3dfwygKig, https://youtu.be/zw99PZalGqA)
Thanks, Naveen AutomationLabs for the guidance and motivation.
Different ways to inspect disappearing elements on a browser was originally published in Level Up Coding on Medium, where people are continuing the conversation by highlighting and responding to this story.
This content originally appeared on Level Up Coding - Medium and was authored by Anshita Bhasin
Anshita Bhasin | Sciencx (2022-10-11T11:54:33+00:00) Different ways to inspect disappearing elements on a browser. Retrieved from https://www.scien.cx/2022/10/11/different-ways-to-inspect-disappearing-elements-on-a-browser/
Please log in to upload a file.
There are no updates yet.
Click the Upload button above to add an update.
