This content originally appeared on Level Up Coding - Medium and was authored by Mohamadou Abdoul Bagui
If you are new to the world of computer development like I was a few years ago, you are probably wondering what a stack is. No worries, allow me to enlighten you.
A stack is a collection of tools used to create and manage computer programs. It is also known as “tech stack” or “software stack”. Consider it as an ecosystem of data that includes the underlying tools, frameworks, and libraries required to create and maintain an application. For instance, one of the most well-liked tech stacks of 2022 is the MEAN stack (MongoDB, Express.js, AngularJS, and Node.js). Also worth mentioning is the MERN stack, which is quite similar to the one before but uses React instead of Angular.
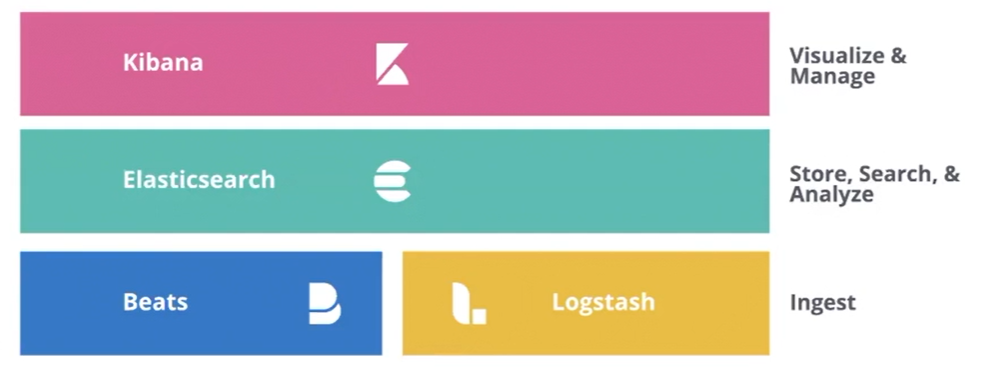
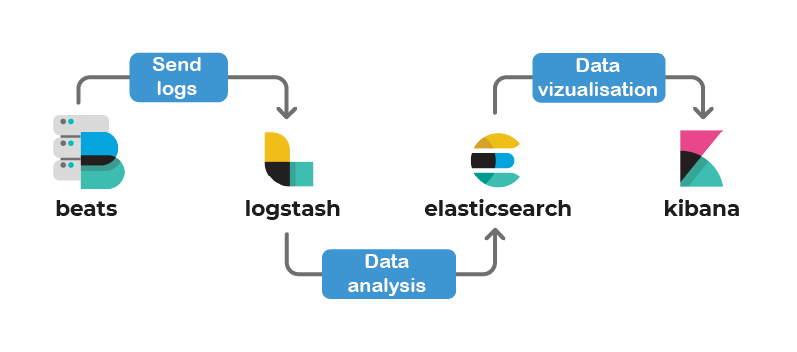
ELK is an example of an open source stack that consisted of 3 main components: Elasticsearch, Logstash and Kibana. Beats was then added to form the ELK stack. The ELK stack allows indexing and analysis of data. We can load different types of data, such as logs, and visualize them in the form of diagrams.

Let’s see in details each element of the stack and its role:
- Elasticsearch is without a doubt the brains of the stack. Data storage and accessibility are its two main functions. Although it has many applications, its primary function is the indexing of data streams. Elasticsearch uses JSON to store data. Indexes, which are databases, hold this data.
- Logstash allows data to be aggregated and formatted before being delivered to Elasticsearch. Think about moving the data from a relational database to Elasticsearch. In this situation, connecting to your database and transforming the data before sending it to Elasticsearch are both possible using Logstash. Due to the volume of operations to be performed, Logstash is frequently installed on a separate server to prevent resource cannibalization.
- Kibana will serve as a visualization window once the data has been extracted and submitted to Elasticsearch. In fact, Kibana will let you view Elasticsearch data in real time. Preconfigured dashboards are available with this tool to analyze the returned logs. In addition to monitoring, it is also able to visualize and examine the data.
- Beats is a set of tools that enables the delivery of logs. These tools must be installed on the machines to be monitored. They perform the function of agents, gathering and sending event logs. They include Packetbeat, which is used to ingest network capture files, Filebeat, which is used to ingest log files, Metricbeat, which is used to gather metrics from various systems, etc.

To cut a long tale short, we just learned about the Elastic stack, a collection of four complementary pieces of software:
- Beats: which acts as an agent to bring you the logs.
- Logstash: which allows the aggregation of data in Elasticsearch.
- Elasticsearch: the main component, which centralizes and accesses the information.
- Kibana: which allows the creation of dashboards and the visualization of data in Elasticsearch.
That’s it for today, feel free to check the official documentation for more details. Thanks for reading, if you have questions or comments regarding this article, please feel free to leave a comment below.
I’ll see you next time for more posts.
Abdoul-Bagui M.
Elastic stack in 3 mins was originally published in Level Up Coding on Medium, where people are continuing the conversation by highlighting and responding to this story.
This content originally appeared on Level Up Coding - Medium and was authored by Mohamadou Abdoul Bagui
Mohamadou Abdoul Bagui | Sciencx (2022-10-11T22:06:30+00:00) Elastic stack in 3 mins. Retrieved from https://www.scien.cx/2022/10/11/elastic-stack-in-3-mins/
Please log in to upload a file.
There are no updates yet.
Click the Upload button above to add an update.
