
This content originally appeared on Level Up Coding - Medium and was authored by Maxwell
This article will show you how to use Google Chrome to debug JavaScript with breakpoints.
Why use debugger
This article will show you how to use Google Chrome to debug JavaScript with breakpoints. Before reading this article, one question needs to be asked: Why use breakpoints for debugging? We all know that console.log is the most commonly used debugging method in front-end development, and it simply and directly solves some problems. But when encountering very complex problems, console.log will become unwieldy.
For example:
- A logically complex algorithm When a test case reports an error, it is sometimes difficult to identify the problematic method by visual inspection alone.
- A bug with very complicated steps to reproduce.
- It took 10 minutes to reproduce, but only a certain line of code was traced, and it was necessary to add log a second time to continue to find the problem. View log -> add log -> view log… This process is repeated several times,
- A piece of code that runs a long process
In these cases, breakpoint debugging is very valuable.
Basic usage of Chrome debugger
To facilitate understanding, a simple example is introduced, creating index.html and index.js in a folder, and then importing index.js in index.html. The contents of index.js are as follows:
const greet = () => {
  const greeting = "hello debugger";
  // Browser execution will pause here
  debugger
  console.log(greeting);
};
greet();
console.log("hi maxwell,evaluation done");Run:
npm i -g serve
serve .
Then visit http://localhost:5000 and open the developer tools.At this time, our hello world breakpoint is hit, like this:
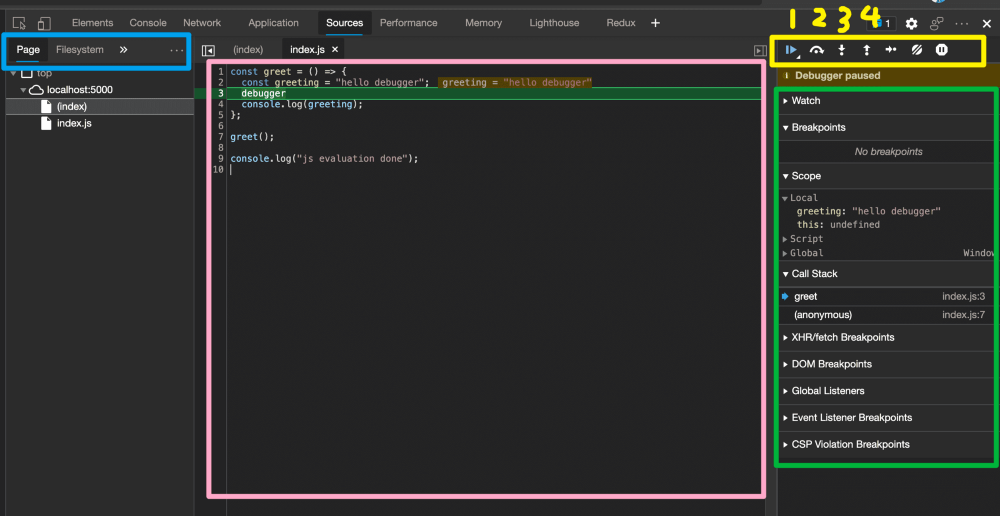
The figure is divided into four areas, the blue area is used for file selection, the Page column refers to the JS files in the current page, and Filesystem will display the files in our system. Usually we use Page.
Pink is the line number and content of the code. You can click on the line number of the code to add a new breakpoint, and click again to cancel.
The yellow area is used to control the execution of the code. You only need to grasp the meaning of the first four buttons to handle most scenarios. Button 1 is to let the code continue execution (resume), and if the next breakpoint is encountered, the execution will be interrupted again. Button 2 can let the browser execute the current line (the third line in the figure), and then interrupt the code on the next line, and button 3 is to enter the current function and view the specific content of the function. Suppose we are currently stopped at line 7 greet() , and clicking button 3 will enter the greet method (ie line 2). If you don’t want to look at the greet method anymore, click button 4 to jump out of this method and go back to line 8.
The green area allows you to view the contents of the variable and the current call stack.
Debugger is the simplest and most rude way of breaking point, but it needs to modify our code. It should be noted that these statements must be removed before going live. It can also be automatically removed by configuring webpack.
Conditional Breakpoint
In some cases, we don’t want every breakpoint hit to play a role, but to execute the line at the breakpoint, and then interrupt the code execution when a certain condition is met. This is a conditional breakpoint.
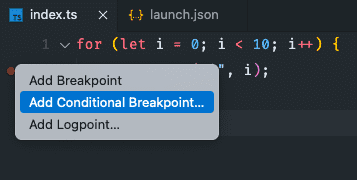
for (let i = 0; i < 10; i++) {
  console.log("i", i);
}
For example, in the above code, assuming we hit a breakpoint on the second line of console.log, this breakpoint will break ten times in total. This is often what we don’t want to see, maybe we need only one of the loops but not all of them. At this point, right-click and select Add Conditional Breakpoint.
An input box will appear where we enter i === 5.
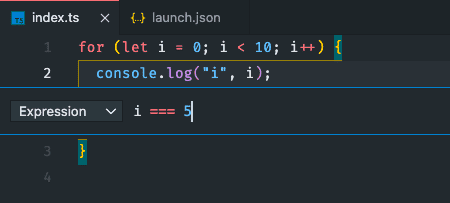
When debugging is started at this time, i will be skipped when i is 0–4, and the code execution will be interrupted directly when i is 5. When code execution is resumed, the cases where i is 6–9 are skipped.
Conditional Breakpoint is extremely useful when debugging with a large number of loops and if else judgments, especially when the logic somewhere is as expected as a whole, and there are only a few special cases of output errors, using conditional breakpoints can skip these normal ones. In some cases, the execution is interrupted only when individual special circumstances occur, so that we can check whether each variable is calculated normally.
Summarize
Debugging is a very important ability in daily work, because in addition to developing new features, a large part of the day is adjusting old code and dealing with logic errors under special conditions. Proficient in debugging can greatly improve development efficiency. A complex bug stuck for a few hours can easily make people collapse. But that’s not to say that breakpoint debugging is a silver bullet for any situation, simple logic can still be console.log happily.
JavaScript Breakpoint Debugging Tips was originally published in Level Up Coding on Medium, where people are continuing the conversation by highlighting and responding to this story.
This content originally appeared on Level Up Coding - Medium and was authored by Maxwell
Maxwell | Sciencx (2022-10-17T00:39:33+00:00) JavaScript Breakpoint Debugging Tips. Retrieved from https://www.scien.cx/2022/10/17/javascript-breakpoint-debugging-tips/
Please log in to upload a file.
There are no updates yet.
Click the Upload button above to add an update.