This content originally appeared on Level Up Coding - Medium and was authored by Chris Bao
Understand Heap Memory Allocation: A Hands-on Approach
Introduction
In my eyes, compared with developing applications with high-level programming languages, one of the biggest differences for system programming with low-level languages like C and C++, is you have to manage the memory by yourself. So you call APIs like malloc, and free to allocate the memory based on your need and release the memory when the resource is no longer needed. It is not only one of the most frequent causes of bugs in system programming; but also can lead to many security issues.
It’s not difficult to understand the correct usage of APIs like malloc, and free. But have you ever wondered how they work, for example:
- When you call malloc, does it trigger system calls and delegate the task to the kernel or there are some other mechanisms?
- When you call malloc(10) and try to allocate 10 bytes of heap memory, how many bytes of memory do you get? 10 bytes or more?
- When the memory is allocated, where exactly the heap objects are located?
- When you call free, is the memory directly returned to the kernel?
This article will try to answer these questions.
Note that memory is a super complex topic, so I can’t cover everything about it in one article (In fact, what is covered in this article is very limited). This article will focus on userland memory(heap) allocation.
Process memory management overview
Process virtual memory
Every time we start a program, a memory area for that program is reserved, and that’s process virtual memory as shown in the following image:
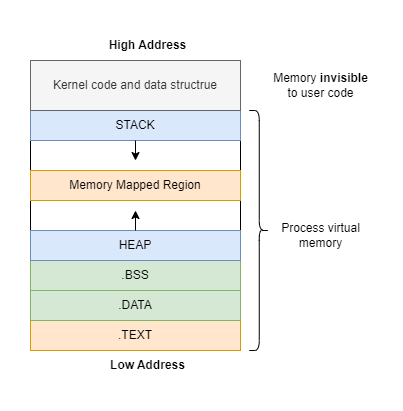
You can note that each process has one invisible memory segment containing kernel codes and data structures. This invisible memory segment is important; since it’s directly related to virtual memory, which is employed by the kernel for memory management. Before we dive into the other different segments, let’s understand virtual memory first.
Virtual memory technique
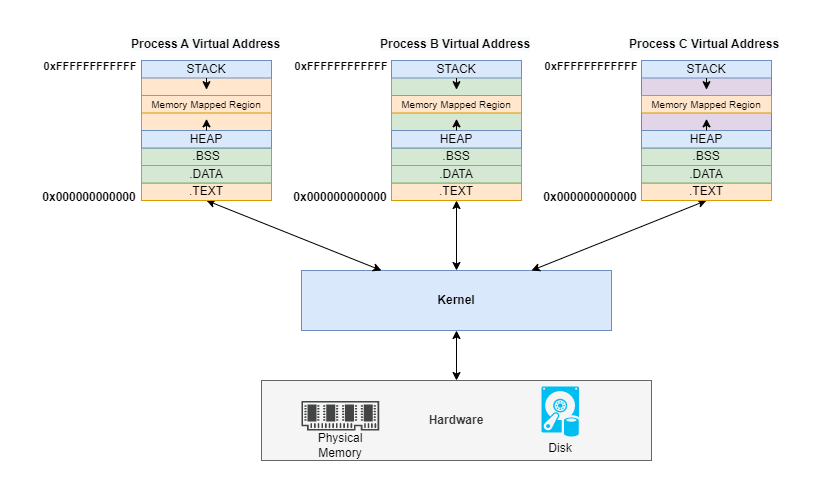
Why do we need virtual memory? Virtual memory is a service provided by the kernel in the form of abstraction. Without virtual memory, applications would need to manage their physical memory space, coordinating with every other process running on the computer. Virtual memory leaves that management to the kernel by creating the maps that allow translation between virtual and physical memory. The kernel creates an illusion that each process occupies the entire physical memory space. We can also realize process isolation based on virtual memory to enhance security.
Virtual memory is out of this article’s scope, if you’re interested, please take a look at the core techniques: paging and swapping.
Static vs Dynamic memory allocation
Next, let’s take a close look at the process memory layout above and understand where they are from. Generally speaking, there are two ways via which memories can be allocated for storing data: static and dynamic. Static memory allocation happens at compile time, while dynamic memory allocation occurs at runtime.
When a program started, the executable file(on the Linux system, it’s called an ELF file) will be loaded into the memory as a Process Image. This ELF file contains the following segments:
- .TEXT: contains the executable part of the program with all the machine codes.
- .DATA: contains initialized static and global variables.
- .BSS: is short for block started by symbol contains uninitialized static and global variables.
The ELF file will be loaded by the kernel and create a process image. And these static data will be mapped into the corresponding segments of the virtual memory. The ELF loader is also an interesting topic, I will write another article about it in the future. Please keep watching my blog!
The memory-mapped region segment is used for storing the shared libraries.
Finally, stack and heap segments are produced at runtime dynamically, which are used to store and operate on temporary variables that are used during the execution of the program. Previously, I once wrote an article about the stack, please refer to it if you want to know the details.
The only remaining segment we didn’t mention yet is the heap, which is this article’s focus!
You can check the memory layout of one process by examining this file /proc/{pid}/maps as below:
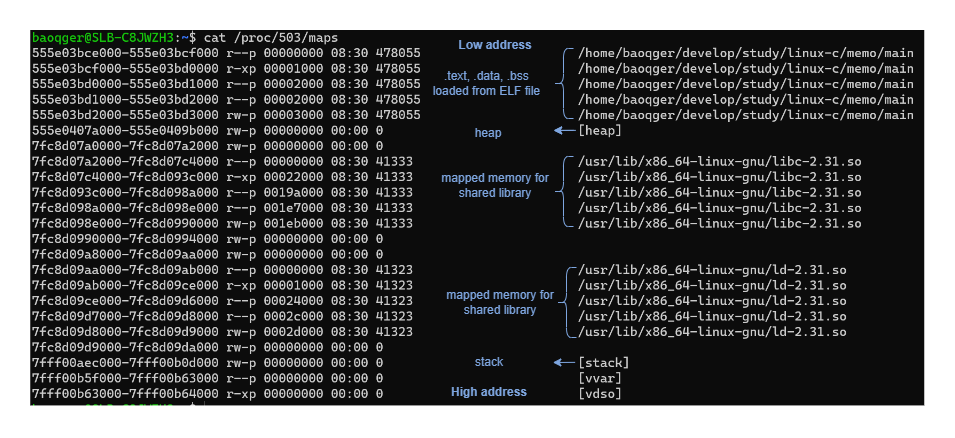
Note that the above investigation doesn’t consider multiple threads. The memory layout of the process with multi-threads will be more complex, please refer to other online documents.
In this section, we had a rough overview of memory management from top to bottom. Hope you can see the big picture and know where we are. Next, let’s dig into the heap segment and see how it works.
Memory allocator
We need to first understand some terminology in the memory management field:
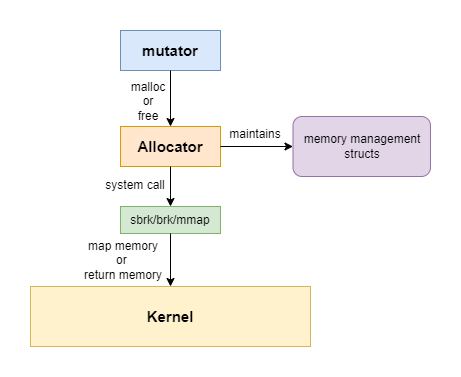
- mutator: the program that modifies the objects in the heap, which is simply the user application. But I will use the term mutator in this article.
- allocator: the mutator doesn’t allocate memory by itself, it delegates this generic job to the allocator. At the code level, the allocator is generally implemented as a library. The detailed allocation behavior is fully determined by the implementations, in this article I will focus on the memory allocator in the library of glibc.
The relationship between the mutator and allocator is shown in the following diagram:
There is a third component in the memory management field: the garbage collector(GC). GC reclaims memories automatically. Since this article is talking about manual heap memory allocation in system programming, we will ignore GC for now. GC is a very interesting technical challenge, I will examine it in the future. Please keep watching my blog!
Hands-on demo
We will use gdb and pwndbg(which is a gdb plugin) and break into the heap memory to see how it works. The gdb provides the functionality to extend it via Python plugins. pwndbg is the most widely used.
The demo code is as follows:
The demo code above just allocates some memory, set the content of the memory and releases it later. And then allocate other chunks of memory again. Very simple, all right?
Allocate chunk
First, set a breakpoint at line 7(the first malloc call) and run the program in gdb. Then run vmmap command from pwndbg, which can get the process memory layout as follows:
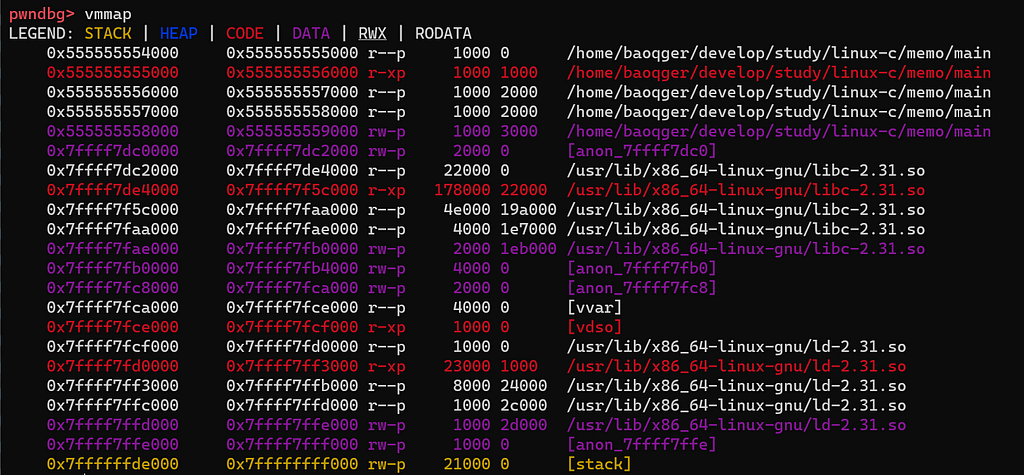
Note that there is no heap segment yet before the first malloc call is made. After step over one line in gdb, check the layout again:
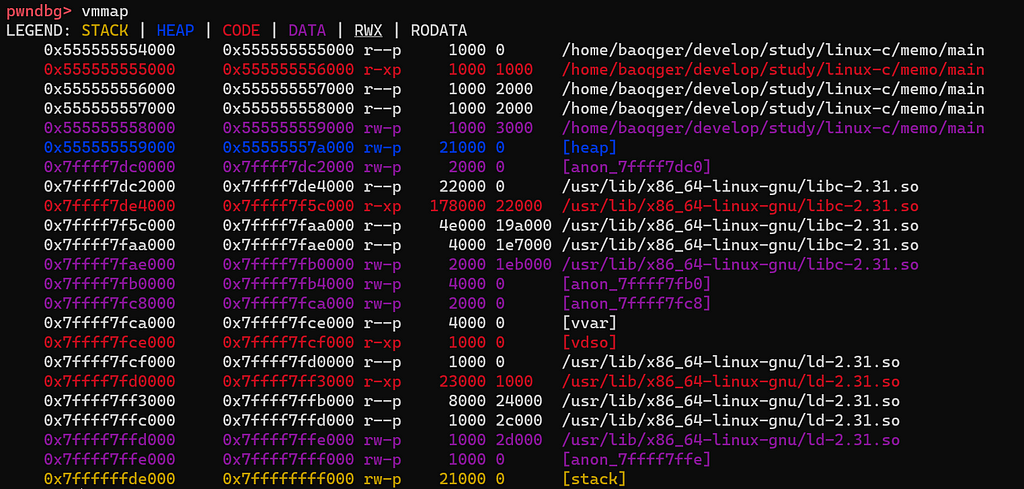
Now the heap segment is created with the size of 132KB(21000 in hexadecimal). As described above, the kernel maps 132KB of physical memory to this process’s virtual memory and marks this 132KB block of physical memory as used to isolate other processes. This mapping routine is done via system calls like brk, sbrk and mmap. Please investigate these system calls yourself.
132KB is much bigger than the 100B(the size passed to malloc). This behavior can answer one question at the beginning of this article. The system calls aren’t necessary to be triggered each time when malloc is called. This design is aimed to decrease performance overhead. Now the 132KB heap memory is maintained by the allocator. Next time the application calls malloc again, the allocator will allocate memory for it.
Next, step one more line in gdb to assign value(“AAAABBBBCCCCDDDD”) to the allocated block. Let’s check the content of this 132KB heap segment with heap command as follows:
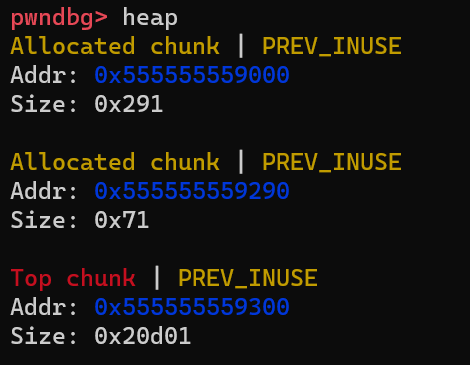
There are 3 chunks. Let’s examine these chunks one by one.
The top chunk contains all the remaining memories which have not been allocated yet. In our case, the kernel maps 132KB of physical memory to this process. And 100B memory is allocated by calling malloc(100), so the remaining memories are in the top chunk. The top chunk stays on the border of the heap segment, and it can grow and shrink as the process allocates more memory or release unused memory.
Then let’s look at the chunk with the size of 0x291. The allocator uses this chunk to store heap management structures. It is not important for our analysis, just skip it.
What we care about is the chunk in the middle with a size of 0x71. It should be the block we requested and contains the string “AAAABBBBCCCCDDDD”. We can verify this point by checking its content:
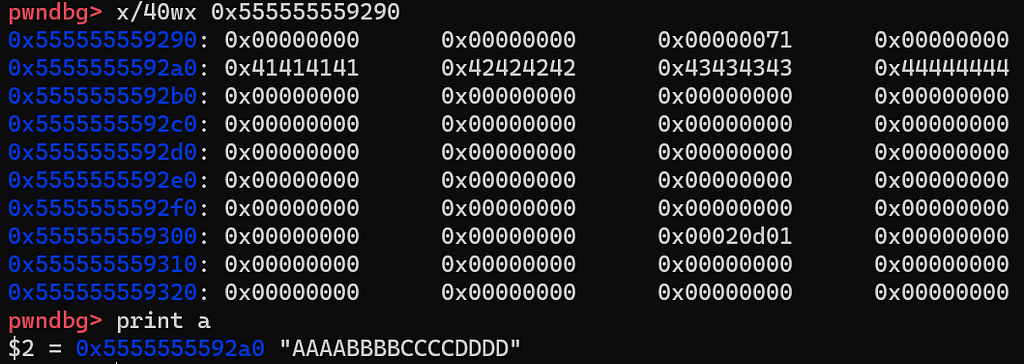
gdb’s x command can display the memory contents at a given address using the specified format. x/40wx 0x555555559290 prints 40 words(each word is 32 bits) of memories starting from 0x555555559290 in the hexadecimal format.
We can see that the string “AAAABBBBCCCCDDDD” is there. So our guess is correct. But the question is why the size of this chunk is 0x71. To understand this, we need to first analyze how the allocator stores chunk. A chunk of memory is represented by the following structure:
- prev_size: the size of the previous chunk only when the previous chunk is free, otherwise when the previous chunk is in use it stores the user data of the previous chunk.
- size: the size of the current chunk.
- fd: pointer to the next free chunk only when the current chunk is free, otherwise when the current chunk is in use it stores the user data.
- bk: pointer to the previous free chunk. Behaves in the same way as pointer fd.
Based on the above description, the following picture illustrates the exact structure of an allocated chunk:

- chunk: indicates the real starting address of the object in the heap memory.
- mem: indicates the returned address by malloc.
The memory in between is reserved for the metadata mentioned above: prev_size and size. On a 64-bit system, they’re (type of INTERNAL_SIZE_T) 8 bytes in length.
For the size field, it is worth noting:
- It includes both the size of metadata and the size of the actual user data.
- It is usually aligned to a multiple of 16 bytes. You can investigate the purpose of memory alignment by yourself.
- It contains three special flags(A|M|P) at the three least significant bits. We can ignore the other two bits for now, but the last bit indicates whether the previous chunk is in use(set to 1) or not(set to 0).
According to this, let’s review the content of this chunk again:
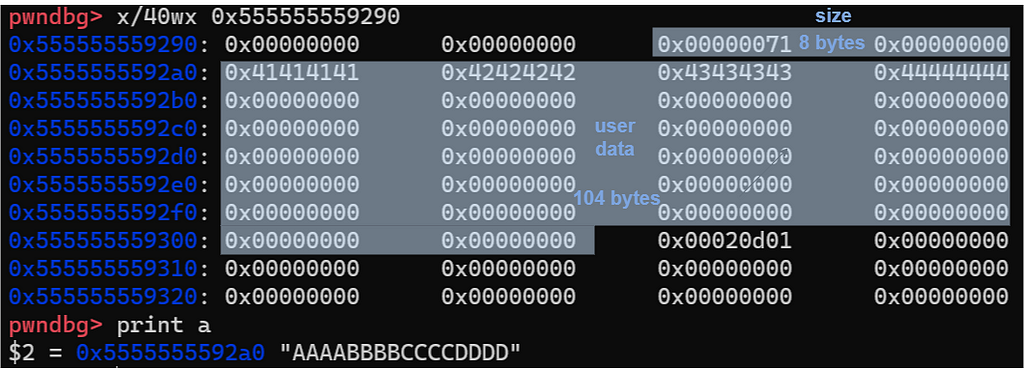
I add marks on the image to help you understand. Let’s do some simple calculations. 100 + 8 = 108, 100 is the size of memory we requested, 8 is the size of metadata(for size field). Then 108 is aligned to 112 as a multiple of 16 bytes. Finally, since the special flag P is set to 1, then we get 112 + 1 = 113(0x71)(that’s the reason why the size is 0x71 instead of 0x70).
In this section, we break into the heap segment and see how an allocated chunk works. Next, we’ll check how to free a chunk.
Free chunk
Previously, we allocated a chunk of memory and put data in it. The next line will free this chunk. Before we run the instruction and show the demo result, let’s discuss the theory first.
The freed chunk will not be returned to the kernel immediately after the free is called. Instead, the heap allocator keeps track of the freed chunks in a linked list data structure. So the freed chunks in the linked list can be reused when the application requests new allocations again. This can decrease the performance overhead by avoiding too many system calls.
The allocator could store all the freed chunks together in a long linked list, this would work but the performance would be slow. Instead, the glibc maintains a series of freed linked lists called bins, which can speed up the allocations and frees. We will examine how bins work later.
It is worth noting that each free chunk needs to store pointers to other chunks to form the linked list. That’s what we discussed in the last section, there’re two points in the malloc_chunk structure: fd and bk, right? Since the user data region of the freed chunk is free for use by the allocator, so it repurposes the user data region as the place to store the pointer.
Based on the above description, the following picture illustrates the exact structure of a freed chunk:

Now step over one line in gdb and check chunks in the heap as follows:

You can see the changes: the allocated chunk is marked as a Free chunk (tcache) and pointer fd is set(which indicates this freed chunk is inserted into a linked list).
The tcache is one kind of bins provided by glibc. The gdb pwndbg plugin allows you to check the content of bins by running command bins as follows:
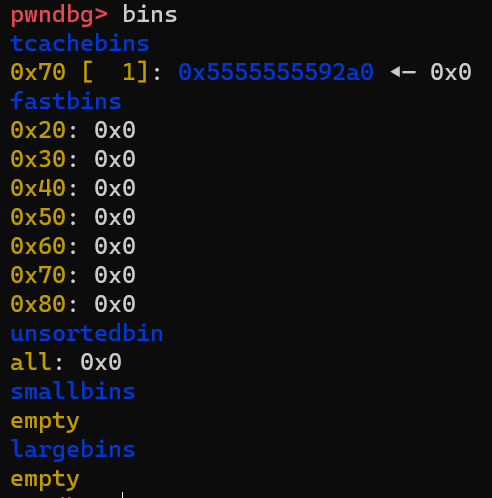
Note that the freed chunk(at 0x5555555592a0) is inserted into tcache bins as the liked list header.
Note that there 5 types of bins: small bins, large bins, unsorted bins, fast bins and tcache bins. If you don’t know, don’t worry I will examine them in the following section.
According to the definition, after the second malloc(100) is called, the allocator should reuse the freed chunk in the bins. The following image can prove this:
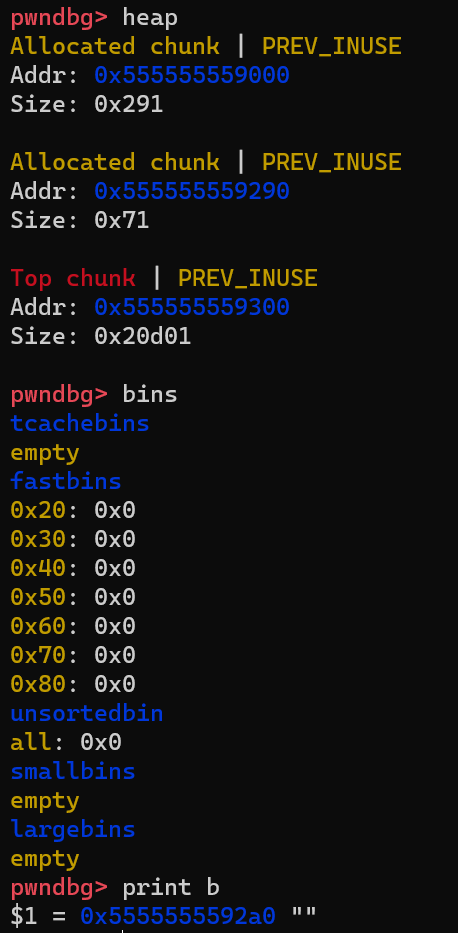
The freed chunk at 0x555555559290 is in use again and all bins are empty after the chunk is removed from the linked list. All right!
Recycling memory with bins
Next, I want to spend a little bit of time examining why we need bins and how bins optimize chunk allocation and free.
If the allocator keeps track of all the freed chunks in a long linked list. The time complexity is O(N) for the allocator to find a freed chunk with fit size by traversing from the head to the tail. If the allocator wants to keep the chunks in order, then at least O(NlogN) time is needed to sort the list by size. This slow process would have a bad impact on the overall performance of programs. That’s the reason why we need bins to optimize this process. In summary, the optimization is done on the following two aspects:
- High-performance data structure
- Per-thread cache without lock contention
High-performance data structure
Take the small bins and large bins as a reference, they are defined as follows:
They are defined together in an array of linked lists and each linked list(or bin) stores chunks that are all the same fixed size. From bins[2] to bins[63] are the small bins, which track freed chunks less than 1024 bytes while the large bins are for bigger chunks. small bins and large bins can be represented as a double-linked list shown below:

The glibc provides a function to calculate the index of the corresponding small(or large) bin in the array based on the requested size. Since the index operation of the array is in O(1) time. Moreover, each bin contains chunks of the same size, so it can also take O(1) time to insert or remove one chunk into or from the list. As a result, the entire allocation time is optimized to O(1).
bins are LIFO(Last In First Out) data structure. The insert and remove operations can be illustrated as follows:
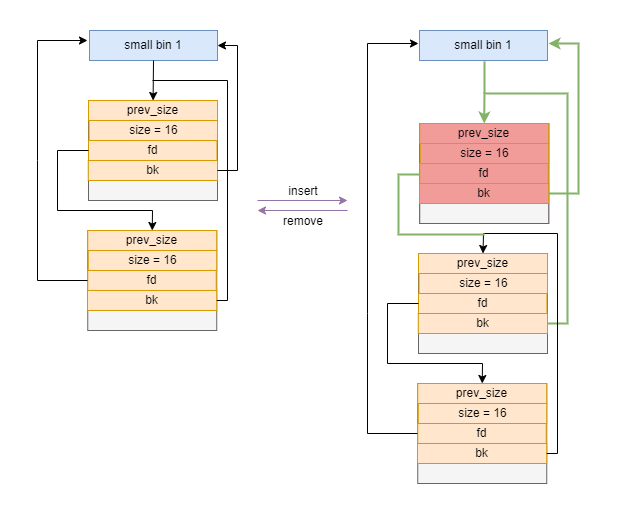
Moreover, for small bins and large bins, if the neighbors of the current chunk are free, they are merged into a larger one. That’s the reason we need a double-linked list to allow running fast traverse both forward and backward.
Unlike small bins and large bins, fast bins and tcache bins chunks are never merged with their neighbors. In practice, the glibc allocator doesn’t set the P special flag at the start of the next chunk. This can avoid the overhead of merging chunks so that the freed chunk can be immediately reused if the same size chunk is requested. Moreover, since fast bins and tcache bins are never merged, they are implemented as a single-linked list.
This can be proved by running the second free method in the demo code and checking the chunks in the heap as follows:
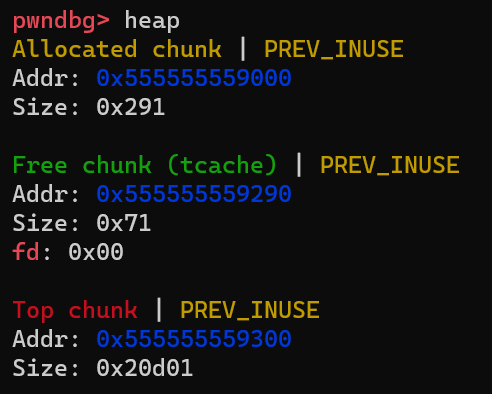
First, the top chunk’s size is still 0x20d01 rather than 0x20d00, which indicates the P bit is equal to 1. Second, the Free chunk only has one pointer: fd. If it’s in a double-linked list, both fd and bk should point to a valid address.
Per-thread cache without lock contention
The letter t in tcache bins represents the thread, which is used to optimize the performance of multi-thread programs. In multi-thread programming, the most common way solution to prevent the race condition issue is using the lock or mutex. Similarly, The glibc maintains a lock in the data structure for each heap. But this design comes with a performance cost: lock contention, which happens when one thread attempts to acquire a lock held by another thread. This means the thread can’t do any tasks.
tcache bins are per-thread bins. This means if the thread has a chunk on its tcache bins, it can serve the allocation without waiting for the heap lock!
Summary
In this article, we examined how the userland heap allocator works by debugging into the heap memory with gdb. The discussion is fully based on the glibc implementation. The design and behavior of the glibc heap allocator are complex but interesting, what we covered here just touches the tip of the iceberg. You can explore more by yourself.
Moreover, I plan to write a simple version of a heap allocator for learning and teaching purpose. Please keep watching my blog!
Understand heap memory allocation: A Hands-on Approach was originally published in Level Up Coding on Medium, where people are continuing the conversation by highlighting and responding to this story.
This content originally appeared on Level Up Coding - Medium and was authored by Chris Bao
Chris Bao | Sciencx (2022-10-19T11:44:34+00:00) Understand heap memory allocation: A Hands-on Approach. Retrieved from https://www.scien.cx/2022/10/19/understand-heap-memory-allocation-a-hands-on-approach/
Please log in to upload a file.
There are no updates yet.
Click the Upload button above to add an update.
