Master These Console Methods To Help You Improve Your Debugging Efficiency!

Besides the most commonly used console.log, what other console methods do you know?

We basically use console.log() debugging method when debugging code, of course, we will use other tools when we encounter complicated ones, but console.log() is basically enough for daily development.

Today we’ll see what other fancy ways of writing console.log().

Use the appropriate log type

  1. console.log() is generally used like this.
console.log('this is a log message');

2. console.info() is handled in the same way as console.log()

console.info('this is an information message');

3. console.warn() Warning message

console.warn('I warned you this could happen!');

4. console.error() Error message

console.error('I\'m sorry Mark, I\'m afraid I can\'t do that');

5. console.debug() Debugging information

console.debug('nothing to see here - please move along');

6. console.table() : output the value of the object in a more friendly format.

const obj = {
propA: 1,
propB: 2,
propC: 3
};
console.table( obj );

or an array of objects:

const arr = [
{ a: 1, b: 2, c: 3 },
{ a: 4, b: 5, c: 6 },
{ a: 7, b: 8, c: 9 }
];

console.table(arr);

Other options include:

  • console.dir(obj) display a JS object’s interactive property list
  • console.dirxml(element) displays an interactive tree of the descendant elements of the specified HTML or XML node.
  • console.clear() clears all information prior to the console.

Filtering log messages

The browser displays log messages in the appropriate color, but can also be filtered to show specific types. Chrome’s sidebar can be opened by clicking on the icon in the top left of the console pane.

Note that the console.debug() message will only be displayed when viewing the verbose option.

Information about using printf-type

All log types can use the c-language style printf message format, which defines a template containing a % indicator of the variable being replaced. For example:

console.log(
'The answer to %s is %d.',
'life, the universe and everything',
42
);
// The answer to life, the universe and everything is 42.

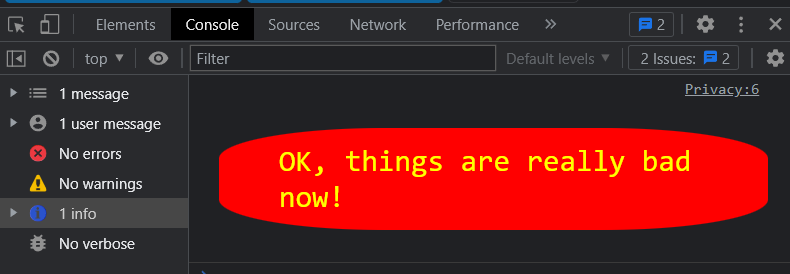
with style:

    console.log(
'%cOK, things are really bad now!',
`
font-size: 2em;
padding: 0.5em 2em;
margin: 1em 0;
color: yellow;
background-color: red;
border-radius: 30%;
`
);

Results in the console:

Use test-like assertions

The test-like console.assert() command can be used to output a message when a condition fails. Assertions can be defined with a condition and one or more objects that are output when that condition fails, for example:

console.assert(
life === 42,
'life is expected to be',
42,
'but is set to',
life
);

Alternatively, a message and a replacement value can be used.

console.assert(
life === 42,
'life is expected to be %s but is set to %s',
42,
life
);

Running a stack trace

You can use console.trace() to output a log of all function calls that constitute the current execution point.

    function callMeTwo() {
console.trace();
return true;
}
function callMeOne() {
return callMeTwo();
}
const r = callMeOne();

The trace shows which line was called each time and can be collapsed or expanded in the console pane at.

Group log messages

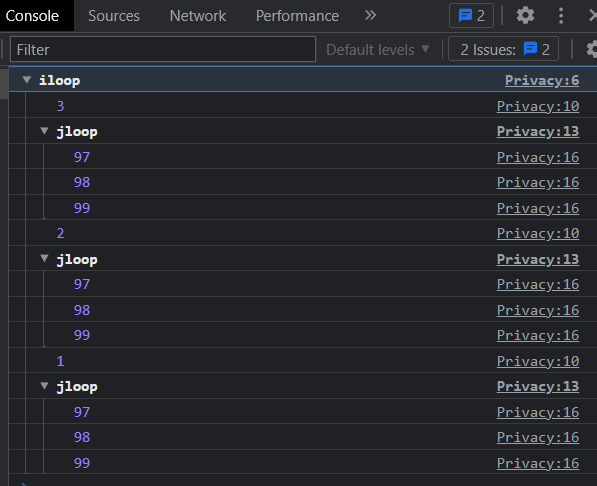
When printing the log, you can split the log messages into named groups using console.group( label ) at the beginning and console.groupEnd() at the end. Message groups can be nested and collapsed or expanded (console.groupCollapsed(label) initially shows the group in a collapsed state).

// start log group
console.group('iloop');

for (let i = 3; i > 0; i--) {

console.log(i);

// start collapsed log group
console.groupCollapsed('jloop');

for (let j = 97; j < 100; j++) {
console.log(j);
}

// end log group (jloop)
console.groupEnd();

}

// end log group (iloop)
console.groupEnd();

Using the timer

The methods console.time and console.timeEnd can be used to allow WEB developers to measure the time consumed by the execution of a javascript script program. As WEB applications become more and more important and the execution performance of JavaScript becomes increasingly important, it is a must for WEB developers to know some performance testing machines.

The console.time method is to start counting the time and console.timeEnd is to stop the timing and output the time of script execution.

    // start timer
console.time('testForEach');

// (some code for testing)

// end timer,output use time
console.timeEnd('testForEach');

// 3522.303ms

A parameter can be passed to both methods as the name of the timer, which serves to separate the timers when the code is run in parallel. A call to console.timeEnd will immediately output the total time consumed by the execution in milliseconds.

If you are interested in my articles, you can follow me on Medium or Twitter.


Master These Console Methods To Help You Improve Your Debugging Efficiency! was originally published in Level Up Coding on Medium, where people are continuing the conversation by highlighting and responding to this story.


This content originally appeared on Level Up Coding - Medium and was authored by Maxwell

Besides the most commonly used console.log, what other console methods do you know?

We basically use console.log() debugging method when debugging code, of course, we will use other tools when we encounter complicated ones, but console.log() is basically enough for daily development.

Today we’ll see what other fancy ways of writing console.log().

Use the appropriate log type

  1. console.log() is generally used like this.
console.log('this is a log message');

2. console.info() is handled in the same way as console.log()

console.info('this is an information message');

3. console.warn() Warning message

console.warn('I warned you this could happen!');

4. console.error() Error message

console.error('I\'m sorry Mark, I\'m afraid I can\'t do that');

5. console.debug() Debugging information

console.debug('nothing to see here - please move along');

6. console.table() : output the value of the object in a more friendly format.

const obj = {
propA: 1,
propB: 2,
propC: 3
};
console.table( obj );

or an array of objects:

const arr = [
{ a: 1, b: 2, c: 3 },
{ a: 4, b: 5, c: 6 },
{ a: 7, b: 8, c: 9 }
];

console.table(arr);

Other options include:

  • console.dir(obj) display a JS object’s interactive property list
  • console.dirxml(element) displays an interactive tree of the descendant elements of the specified HTML or XML node.
  • console.clear() clears all information prior to the console.

Filtering log messages

The browser displays log messages in the appropriate color, but can also be filtered to show specific types. Chrome’s sidebar can be opened by clicking on the icon in the top left of the console pane.
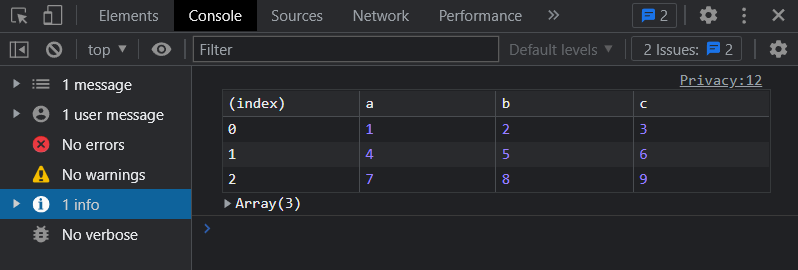
Note that the console.debug() message will only be displayed when viewing the verbose option.

Information about using printf-type

All log types can use the c-language style printf message format, which defines a template containing a % indicator of the variable being replaced. For example:

console.log(
'The answer to %s is %d.',
'life, the universe and everything',
42
);
// The answer to life, the universe and everything is 42.

with style:

    console.log(
'%cOK, things are really bad now!',
`
font-size: 2em;
padding: 0.5em 2em;
margin: 1em 0;
color: yellow;
background-color: red;
border-radius: 30%;
`
);

Results in the console:
Use test-like assertions

The test-like console.assert() command can be used to output a message when a condition fails. Assertions can be defined with a condition and one or more objects that are output when that condition fails, for example:

console.assert(
life === 42,
'life is expected to be',
42,
'but is set to',
life
);

Alternatively, a message and a replacement value can be used.

console.assert(
life === 42,
'life is expected to be %s but is set to %s',
42,
life
);

Running a stack trace

You can use console.trace() to output a log of all function calls that constitute the current execution point.

    function callMeTwo() {
console.trace();
return true;
}
function callMeOne() {
return callMeTwo();
}
const r = callMeOne();

The trace shows which line was called each time and can be collapsed or expanded in the console pane at.

Group log messages

When printing the log, you can split the log messages into named groups using console.group( label ) at the beginning and console.groupEnd() at the end. Message groups can be nested and collapsed or expanded (console.groupCollapsed(label) initially shows the group in a collapsed state).

// start log group
console.group('iloop');

for (let i = 3; i > 0; i--) {

console.log(i);

// start collapsed log group
console.groupCollapsed('jloop');

for (let j = 97; j < 100; j++) {
console.log(j);
}

// end log group (jloop)
console.groupEnd();

}

// end log group (iloop)
console.groupEnd();
Using the timer

The methods console.time and console.timeEnd can be used to allow WEB developers to measure the time consumed by the execution of a javascript script program. As WEB applications become more and more important and the execution performance of JavaScript becomes increasingly important, it is a must for WEB developers to know some performance testing machines.

The console.time method is to start counting the time and console.timeEnd is to stop the timing and output the time of script execution.

    // start timer
console.time('testForEach');

// (some code for testing)

// end timer,output use time
console.timeEnd('testForEach');

// 3522.303ms

A parameter can be passed to both methods as the name of the timer, which serves to separate the timers when the code is run in parallel. A call to console.timeEnd will immediately output the total time consumed by the execution in milliseconds.

If you are interested in my articles, you can follow me on Medium or Twitter.


Master These Console Methods To Help You Improve Your Debugging Efficiency! was originally published in Level Up Coding on Medium, where people are continuing the conversation by highlighting and responding to this story.


This content originally appeared on Level Up Coding - Medium and was authored by Maxwell


Print Share Comment Cite Upload Translate Updates
APA

Maxwell | Sciencx (2022-11-20T21:30:48+00:00) Master These Console Methods To Help You Improve Your Debugging Efficiency!. Retrieved from https://www.scien.cx/2022/11/20/master-these-console-methods-to-help-you-improve-your-debugging-efficiency/

MLA
" » Master These Console Methods To Help You Improve Your Debugging Efficiency!." Maxwell | Sciencx - Sunday November 20, 2022, https://www.scien.cx/2022/11/20/master-these-console-methods-to-help-you-improve-your-debugging-efficiency/
HARVARD
Maxwell | Sciencx Sunday November 20, 2022 » Master These Console Methods To Help You Improve Your Debugging Efficiency!., viewed ,<https://www.scien.cx/2022/11/20/master-these-console-methods-to-help-you-improve-your-debugging-efficiency/>
VANCOUVER
Maxwell | Sciencx - » Master These Console Methods To Help You Improve Your Debugging Efficiency!. [Internet]. [Accessed ]. Available from: https://www.scien.cx/2022/11/20/master-these-console-methods-to-help-you-improve-your-debugging-efficiency/
CHICAGO
" » Master These Console Methods To Help You Improve Your Debugging Efficiency!." Maxwell | Sciencx - Accessed . https://www.scien.cx/2022/11/20/master-these-console-methods-to-help-you-improve-your-debugging-efficiency/
IEEE
" » Master These Console Methods To Help You Improve Your Debugging Efficiency!." Maxwell | Sciencx [Online]. Available: https://www.scien.cx/2022/11/20/master-these-console-methods-to-help-you-improve-your-debugging-efficiency/. [Accessed: ]
rf:citation
» Master These Console Methods To Help You Improve Your Debugging Efficiency! | Maxwell | Sciencx | https://www.scien.cx/2022/11/20/master-these-console-methods-to-help-you-improve-your-debugging-efficiency/ |

Please log in to upload a file.


There are no updates yet.
Click the Upload button above to add an update.

You must be logged in to translate posts. Please log in or register.