This content originally appeared on Level Up Coding - Medium and was authored by Auxo
Write better software diagrams for you, your team, and all involved stakeholders by following some simple guidelines.
Be an engineer, not an artist — based on Simon Brown’s talk
Introduction
Good software diagrams avoid ambiguity, improve communication, and are understood by all stakeholders, whether they are DevOps engineers, developers, product owners, testers, etc. However, today’s software diagrams are full of colors, shapes, and symbols that nobody understands.
The aim of this article is to improve your software diagrams for your next project with some simple-to-follow tips. All these guidelines are taken from Simon Brown’s presentations on the C4 Software Architecture Model. We use these best practices for every diagram we design, which has helped us model more precise and beautiful software diagrams.
Use Titles in Your Diagram
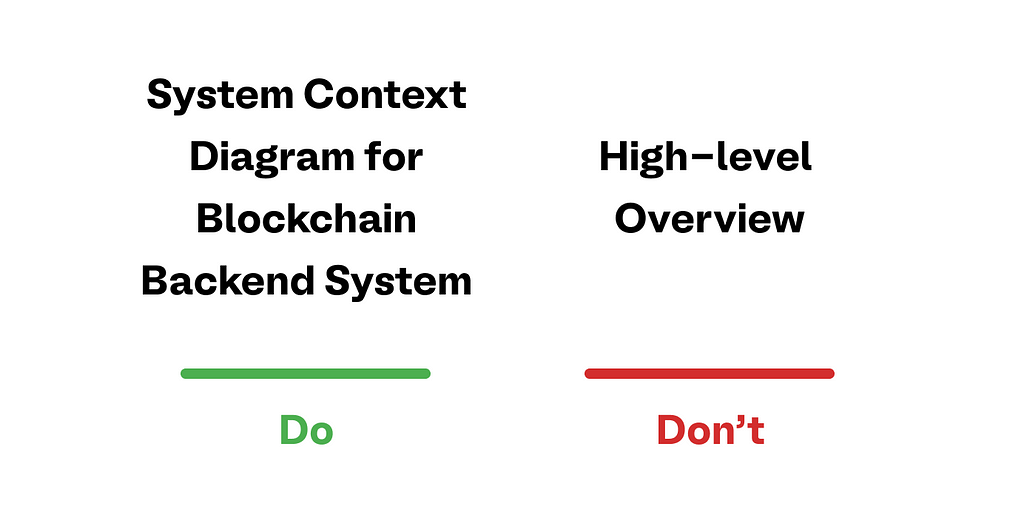
It is a quick and effective fix: Each diagram should have a short title. The title should be meaningful and mention the type of diagram. For example, if it is a deployment diagram, you should be able to see this immediately from the title.
Tip: Add a number to the title if the diagram order is essential.
Use a Legend in Your Diagram
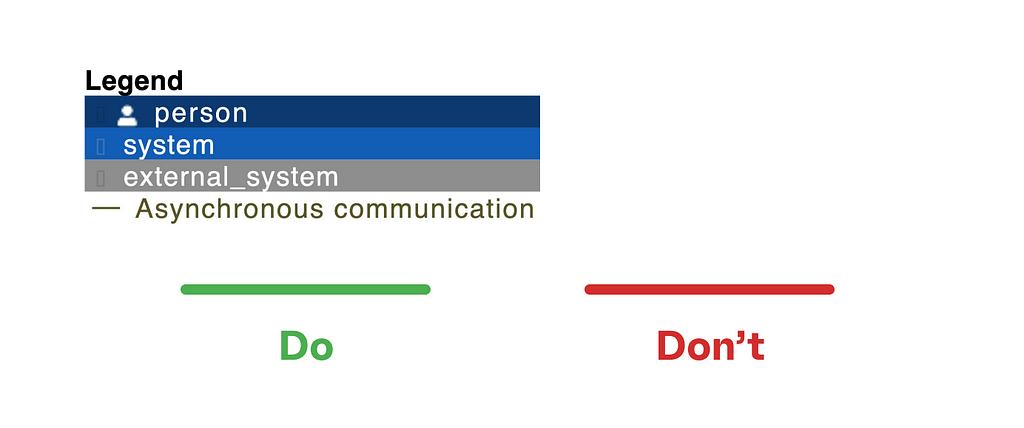
How often do you ask yourself what the color means again, even though you knew it last week? A missing legend is a mistake that can cost you and your teammates many hours. Therefore: Explain all forms, line styles, colors, borders, abbreviations, etc. — even if they are apparent. Your future self will thank you.
Be Visually Consistent

We name code variables and methods uniformly. For presentations, we only use consistent fonts for headings and texts. Why should we make an exception for diagrams?
For this reason, try using the same colors, shades, and shapes across all diagrams. Always place the same things in the same place. For example, if you have users in the top left in one diagram, put them in the same place in your other diagrams.
Use Useful Labels for Your Lines and Relationships
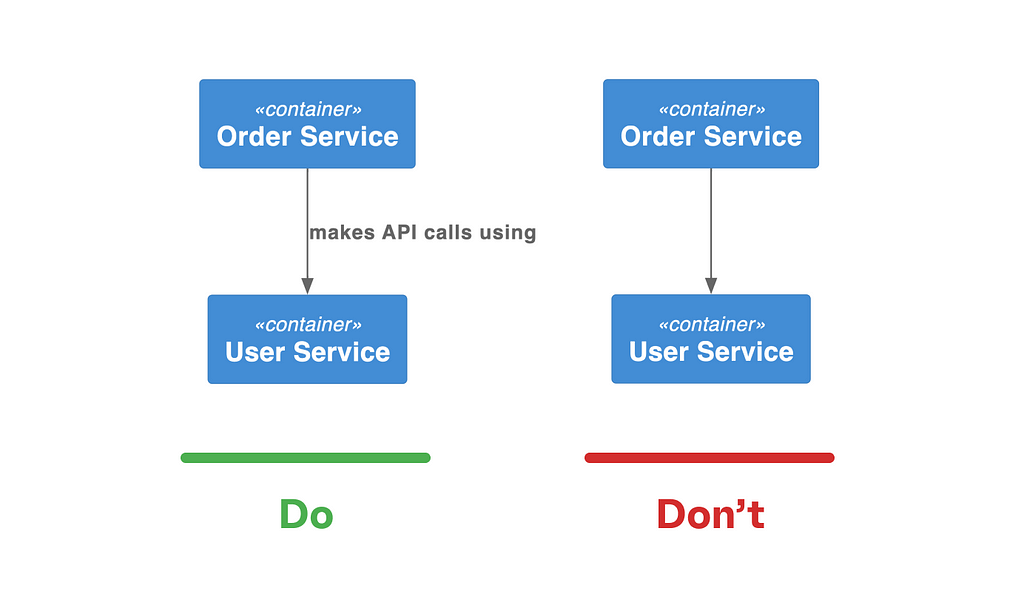
Labeled relationships and links help readers understand your diagrams better. Try to avoid generic labels such as uses because there is no added value, but try to describe the relationship briefly and precisely. Your annotation should be explicit about the purpose of the line and direction.
Favor Uni-Directional Lines
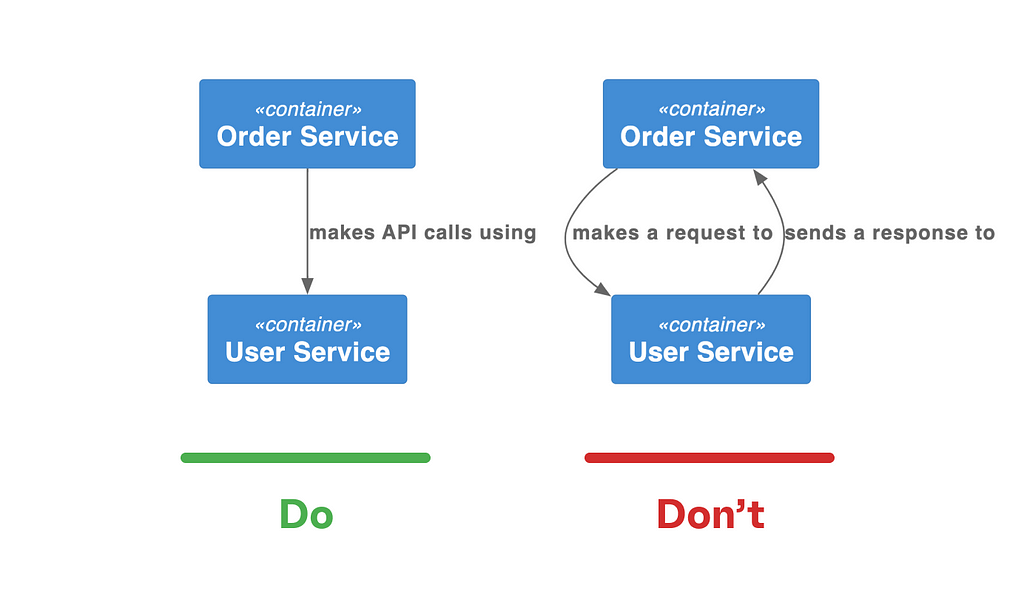
In general, lines with no arrowheads or links with arrowheads on both sides make it difficult to read diagrams smoothly. The data flow is often ambiguous, and one does not know which component has which dependencies. Therefore, try to favor uni-directional lines by summarising the intent of the relationship. But yet be precise! Instead of having two lines for sending a request and receiving a response, summarize it into a single directional line stating that it makes an API request. With this approach, your diagram is less cluttered.
Tip: The link should point in the direction that fits the link’s label. E.g., service A calls service B, or service A depends on service B.

If the two links between two components have different purposes, do not combine them into one link, but show both directions to avoid confusion.
Add More Words and Read Out Loud Your Diagram
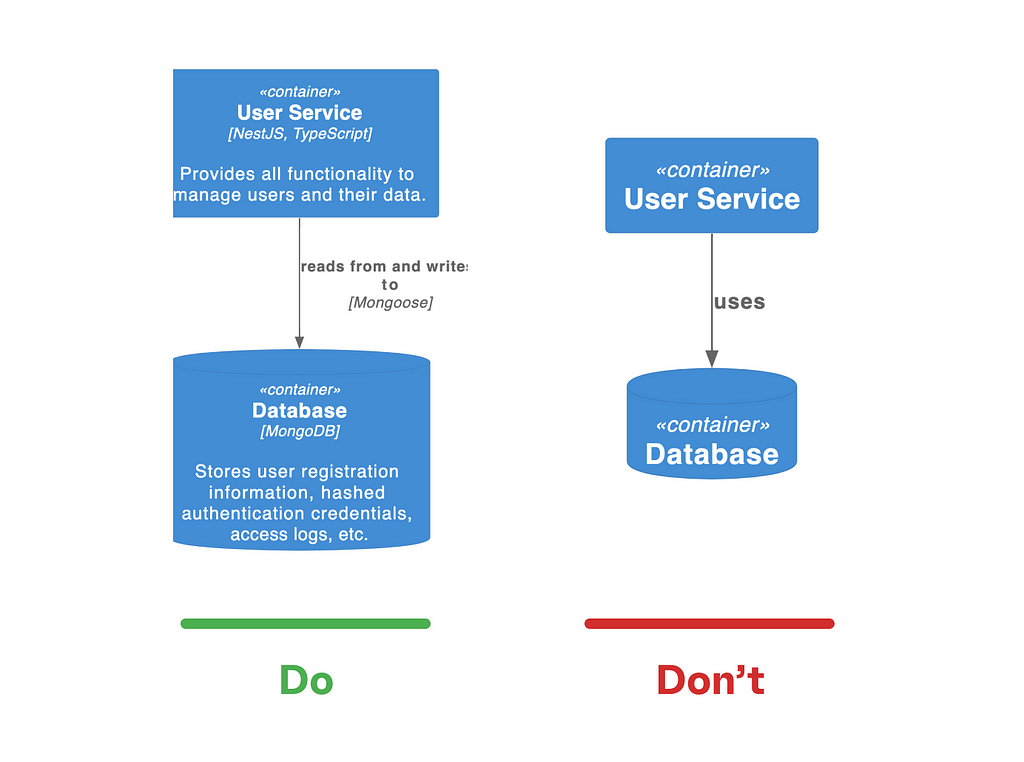
Short descriptions for your components and connections make your diagrams much easier to understand. But that doesn’t mean you should write entire essays. Try to be precise, but in general, it means here: More [words] is better.
As you create your diagram, always read it out loud to yourself and make sure it sounds fluent and makes sense.
Use Icons To Supplement Text, Not To Replace It
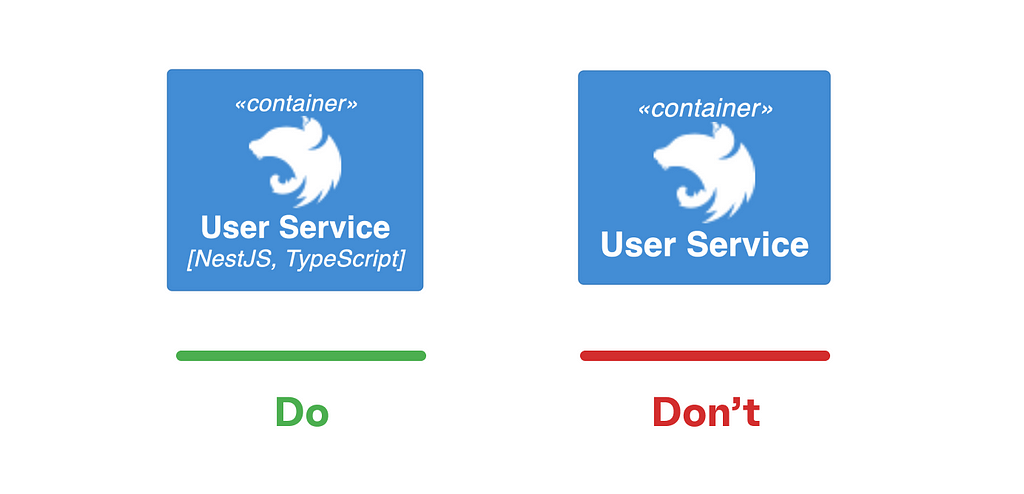
Icons make your diagrams more beautiful. We understand that. But the problem with icons is that not everyone knows what they mean. Therefore, only add icons if your diagram can be understood without them, and there is no loss of information if you remove all icons from your diagram.
Add Colors, Shapes, and Different Sizes for Aesthetic Purposes Only
Before you share your diagram with others, try the following: Remove all colors, shapes, and sizes and ask your work colleague if the naked diagram is still understandable.
What we mean is that different colors and shapes make your diagram more beautiful, but before you add colors and other things, your diagram has to make sense. Other stakeholders might not understand why you used that particular color, so they need to be able to understand the diagram without color.
Do Not Use Acronyms
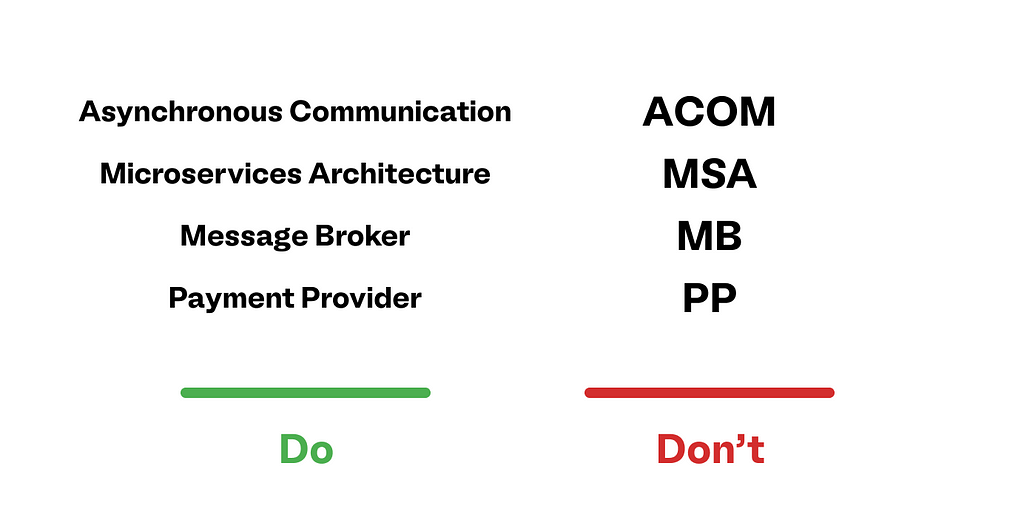
Never use abbreviations because no one will understand them. This classic tip applies to diagrams and everything involved with more than one person. There are abbreviations that everyone knows. For example, you don’t have to write out Hypertext Transfer Protocol for HTTP. But these exceptions are rare, therefore, think twice before using them.
Look at this e-mail from Elon Musk for his SpaceX employees about how acronyms suck.
Conclusion
This article has hopefully given you some simple tips on making your software diagrams more readable in the future. Here is a brief summary of the post’s content:
- Use a title
- Use a legend
- Be visually consistent
- Use labels for your relationships
- Favor uni-directional lines
- Add more words to be more explicit
- Read out loud your diagram
- Use icons to supplement the text but not to replace it
- Use different shapes, colors, sizes, etc. only to complement a diagram
- Do not use acronyms
Last but not least, comments and suggestions are highly welcome, as always.
Modelling Clean and Comprehensible Software Diagrams was originally published in Level Up Coding on Medium, where people are continuing the conversation by highlighting and responding to this story.
This content originally appeared on Level Up Coding - Medium and was authored by Auxo
Auxo | Sciencx (2022-12-02T17:50:39+00:00) Modelling Clean and Comprehensible Software Diagrams. Retrieved from https://www.scien.cx/2022/12/02/modelling-clean-and-comprehensible-software-diagrams/
Please log in to upload a file.
There are no updates yet.
Click the Upload button above to add an update.
