
This content originally appeared on Level Up Coding - Medium and was authored by Asaf Pras
Learn how to extract a raster’s data into a DataFrame for machine learning and AI model inputs.

My research focuses on developing machine learning and artificial intelligence algorithms for water quality monitoring. In this field, real-world data is complex and rare to find, and whenever I get data, it doesn’t contain too many features. That’s why I must add many meta-data features that may affect the target I want to predict. A few months ago, I found out that there is a lot of data which is stored in pictures called ‘rasters’. So in this article, I will show how to take this raster and extract its data so it can be used as inputs for ML and AI models.
What is a raster?
A raster image is an image file format that’s defined by a pixel with one or more numbers associated with it. The number represents the location, size, or color of the pixels. Raster images are commonly BMP, GIF, JPEG, PNG, and TIFF files. These files can represent almost any data — geographical, geological, climate, weather, population, and more. In addition, these files have coordinates so they can be projected on or as a map.

Let’s start
As always, we must import all the libraries we will use, and before that, we will ask the Jupyter Notebook to present all figures inline. First, the database will be managed in Pandas, a library software written for Python for data manipulation and analysis of tabular data, and its geospatial twin GeoPanda, which allows manipulations and analysis of geospatial data. Obviously, we will import Matplotlib for plotting the figures later and Numpy for some mathematical manipulations. Last, we will import Rasterio, which will be used for opening the rasters, manipulating, and plotting them.
Load the data
The data we will use as an example will be the locations of water samples, but without the other data. First, we will load the excel table as a pandas DataFrame with the .read_excel() method and drop rows with NaNs, which axis=0 refers to dropping the rows (and not the columns). Next, we will clean the data from non-numeric values as some of the coordinates are invalid (we can fix them, but it’s not essential for this example).
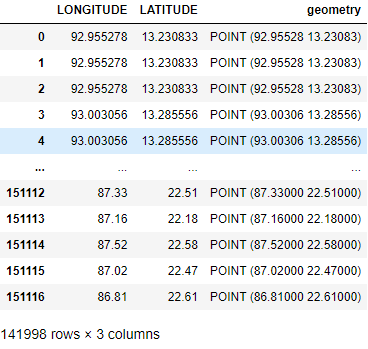
Now, we need to convert it into a GeoDataFrame. This method takes two most important parameters: (1) the data itself and (2) the geometry we want to represent the data. In our case, we will present the data as points where the location is determined with the.points_from_xy() method that takes 2 arguments: longitude and latitude.

The last part will be changing the coordinate reference system (CRS), which is a coordinate-based local, regional or global system used to locate geographical entities. A spatial reference system defines a specific map projection, as well as transformations between different spatial reference systems. If you are not sure what CRS you should use, you can check on this website. For India’s mainland, we will use EPSG:4243.
So the DataFrame we have now is a GeoDataFrame, which differs because of the ‘geometry’ column.
Next, we will load India’s shapefile, which format is a geospatial vector data format for geographic information system software. This can also be done with GeoPandas with the .read_file() method that takes the shapefile path as an argument. Then we must remember to set the shapefile’s CRS the same as our data is with the .set_crs() method. Let’s plot it to see how it looks:
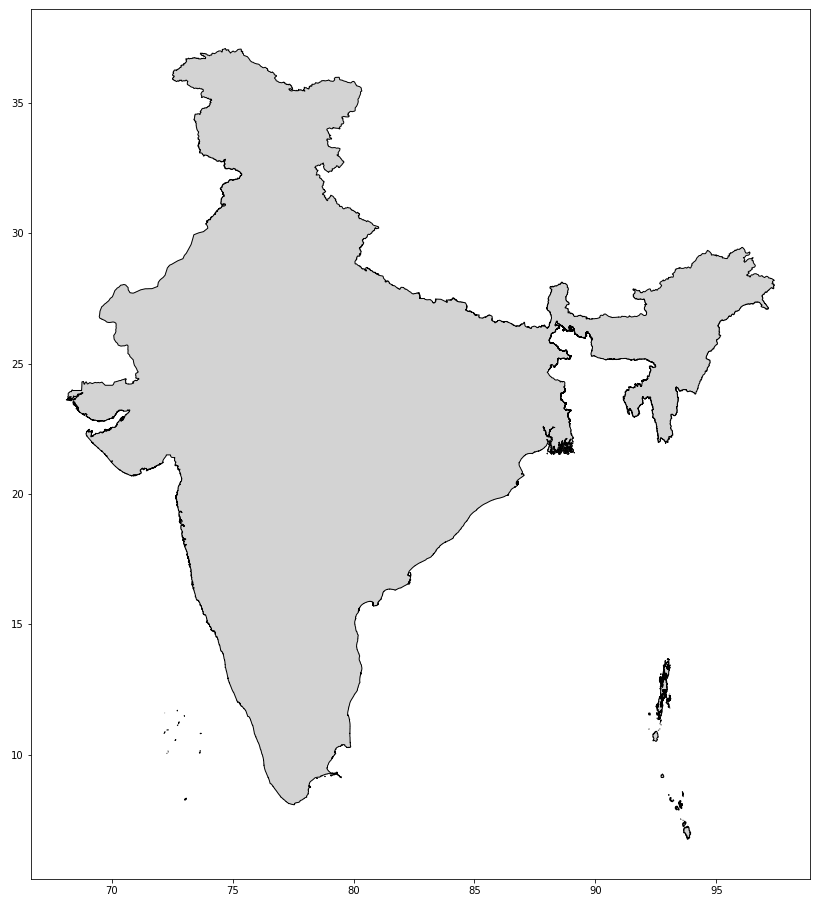
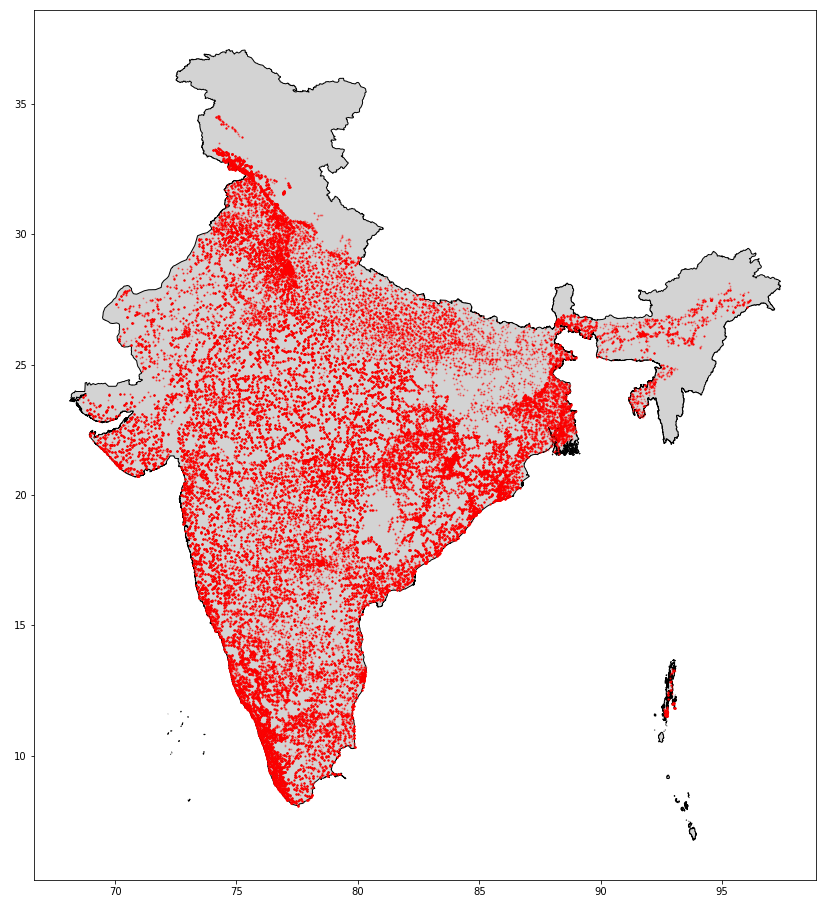
W can see that we get the boundaries of India (including its island) with the axes as coordinates. Let’s plot the points to see how they look on a map:

As can be seen from both axis — we have points with wrong coordinates. If it were a small dataset or important for the example, I would try to find out which ones are wrong and correct them, but in this case, we will filter all data points that are outside of the boundary of India, as in the next steps they won’t get any real data added to them from the rasters. These points probably had a mistake when they were recorded.
GeoPandas provides us with a great and easy way to screen this data. We will use a spatial join between our dataset and our shapefile and keep only the points where the coordinates are ‘within’ the ‘inner’ part of the shapefile. This can be done with the .sjoin() method. After using this method, our DataFrame will also consist of index_right and Area columns, so we will drop those and plot to see the results:
Extract the data
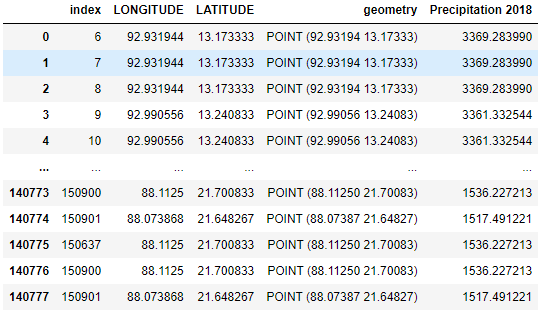
Last step. We will spatial join the data for each data point from the raster and the shapefiles so that each point will hold its data based on the coordinates. For that, we need to make sure that we are using the same CRS also for the raster. The code below is written for extracting multiple rasters and adding them to the DataFrame, and therefore it uses the os and glob libraries and the path to the folder that holds all the rasters.

First, we need to extract all point’s longitude and latitude as x and y, which can be easily done with the .x and .y methods. Next, we will use Rasterio’s.open method to open the raster, as the following line is the center of this part. by using the Rasterio’s.sample method that takes the coordinates list as an input, we will sample for each coordinate the raster value at that location. In addition, in the same line, we already assign the value to the new column in our DataFrame (giving it the same name as the raster, just without the ‘.tif’, in this example).
Finally, we got the result we so wanted, and we are ready to go with our ADE, building up a model or whatever you needed this data for.
And that really is it!
I’ll stop here, and you can find the full code here, including some parts that I skipped, such as clipping the global raster into India’s and more. And if you have any thoughts or questions, feel free to leave a comment 🙂
Thanks for reading! 👍
Level Up Coding
Thanks for being a part of our community! Before you go:
- 👏 Clap for the story and follow the author 👉
- 📰 View more content in the Level Up Coding publication
- 🔔 Follow us: Twitter | LinkedIn | Newsletter
🚀👉 Join the Level Up talent collective and find an amazing job
Use Raster’s Data as ML and AI Inputs was originally published in Level Up Coding on Medium, where people are continuing the conversation by highlighting and responding to this story.
This content originally appeared on Level Up Coding - Medium and was authored by Asaf Pras
Asaf Pras | Sciencx (2022-12-06T12:38:16+00:00) Use Raster’s Data as ML and AI Inputs. Retrieved from https://www.scien.cx/2022/12/06/use-rasters-data-as-ml-and-ai-inputs/
Please log in to upload a file.
There are no updates yet.
Click the Upload button above to add an update.