This content originally appeared on Level Up Coding - Medium and was authored by Anas Anjaria
Continuous Archiving and Point-in-Time Recovery
Debugging tools you’ll love …
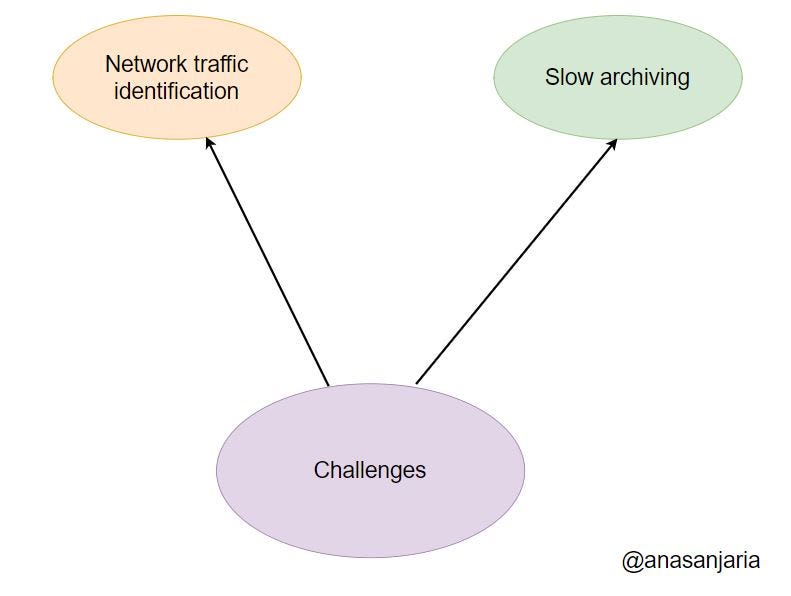
While working on continuous archiving and point-in-time recovery tasks, I encountered different challenges. They are as under:
- Identification of network traffic.
- Slow archiving to the AWS cloud.
To resolve the above challenges, I used different Linux tools, and that’s the focus of this post.
In this post, you will learn about:

- Challenges I faced before rolling our archiving process to the production
system.
- Linux debugging tools namely iftop & iotop.
- Essential AWS cloud watch metrics helped identify bottleneck.
- How I used these tools (kind of setup) in a testing environment?
Identification of network traffic
Context
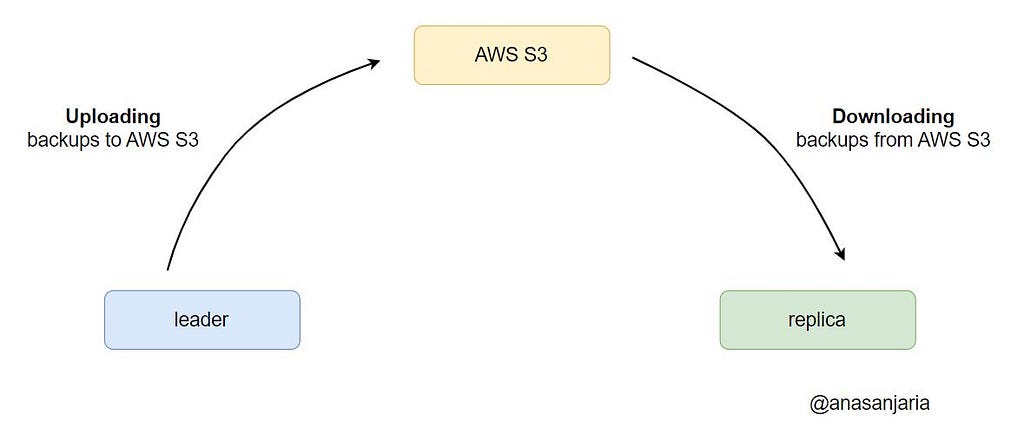
As we store backups in the AWS cloud, so I need to ensure that:
- A leader node uploads backups to the AWS cloud.
- A replica node (upon adding to the cluster) downloads backups from the AWS cloud.
Challenge
Identification of network traffic from a leader node to the AWS cloud was easy & evident due to the following reasons:
- We can create a cluster containing only a leader node.
- Locate backups in the AWS cloud.
However, it was challenging to identify network traffic from the AWS cloud to a replica node due to a small-sized database.
I used small-sized database during development for fail-fast reasons.
Tools helped me to resolve it
iftop command helped to resolve this challenge. It’s a Linux command to monitor network traffic that shows real-time information about our network bandwidth usage.
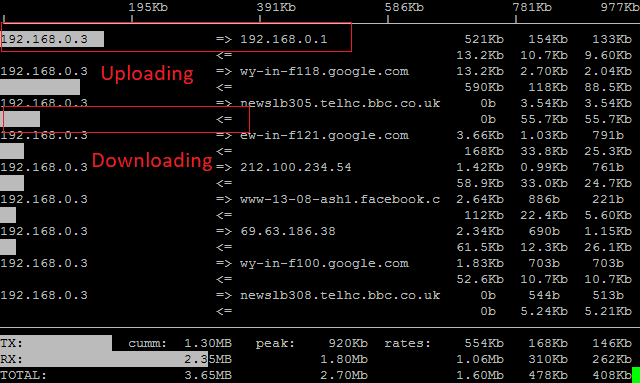
I added two instances on the AWS cloud that forms a cluster and run this command to monitor network traffic.
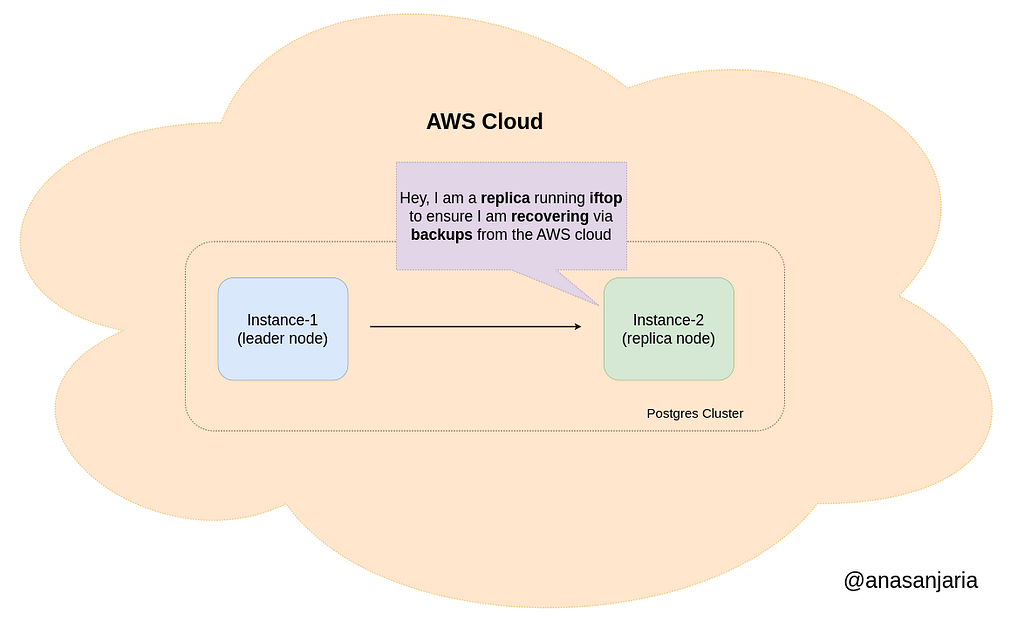
As I mentioned in my article
Adding a replica node will not always download backups from the AWS cloud, but depends on the configuration settings.
I came to know about this fact due to this experiment.
Slow archiving to the AWS cloud
Context
After successfully working with a small-sized test database, we plan to test it for a production-sized database (~1.5 TB).
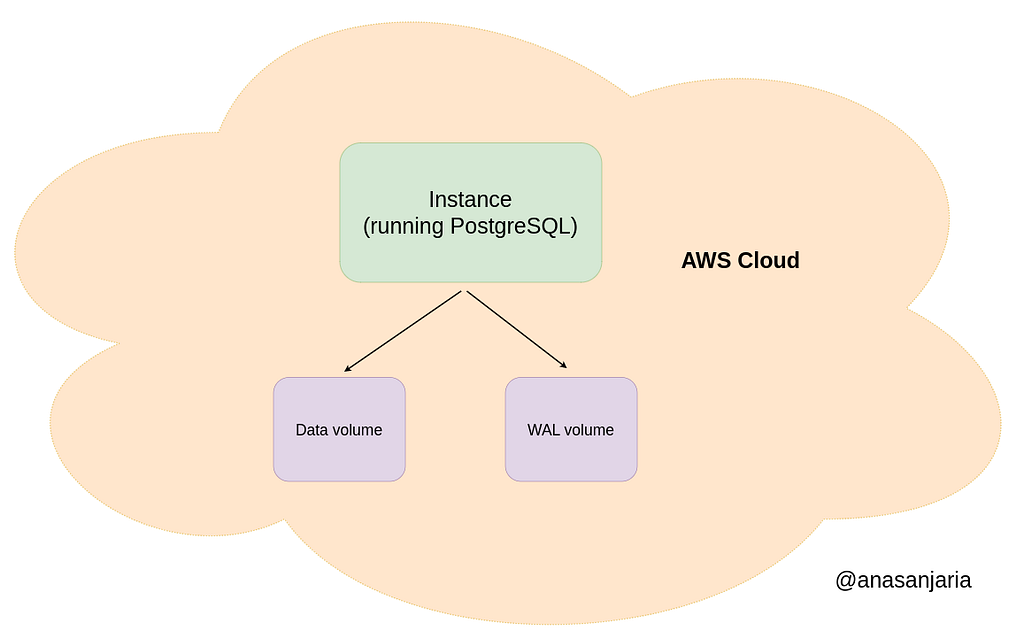
We persist data with ZFS compression on the disk. Furthermore, our system uses two volumes:
- WAL volume — Storing Write Ahead Log (WAL) segments only (not using any compression).
- Data volume — Storing the rest of the PostgreSQL folder structure (using ZFS compression).
Challenge
We observed that archiving was very slow, took more than 1 day, and didn’t finish. This was very surprising to us.
Tools helped me to identify bottleneck
iotopand AWS EBS metrics (particularly VolumeIdleTime, VolumeQueueLength& VolumeTotalReadTime) helped me to identify bottlenecks.
VolumeIdleTime - The total number of seconds in a specified period of time
when no read or write operations were submitted.

VolumeQueueLength - The number of read and write operation requests waiting
to be completed in a specified period of time.

VolumeTotalReadTime - The total number of seconds spent by all read operations
that completed in a specified period of time.

Source: AWS EBS volume metrics
First, we checked whether uploading to the AWS cloud is slow using iotop.
# only intested in IO activities of postgresql user
iotop -u <POSTGRES-USER-ID-HERE>
Uploading was slow (at a constant rate of 5 MB/s).
Upon further investigation, we observed via the AWS metrics for the data volume that:
% Time Spend Idlewas slowly decreasing and reached zero, Average Queue Length (operations) and Average read latency (ms/op)are significantly high (factor of 6x with respect to the production system).
However, the same metrics are normal (compared with respect to the production system) for WAL volume.
This indicates an IO bottleneck for data volume, and the obvious guess was something with the ZFS file system.
Solution
Performing different experiments, we came to the conclusion that it was a problem with our setup.
Setup — We created the AWS EBS volume from the AWS snapshot and formatted the data volume using the ZFS file system and WAL volume with ext4 file system.
Upon enabling the archiving process, each file is read (or accessed) for the first time by the wal-g process from the disk in the ZFS file system, hence it was slow.
This would not cause any problems in the production system since the wal-g process would not be the one accessing the file system for the first time, hence it was fast.
Thanks for reading.
If you have any questions, please feel free to ask in the comment section.
If you enjoy this post, you might also enjoy my series on continuous archiving & point-in-time recovery in PostgreSQL.
PSQL: Continuous Archiving and Point-in-Time Recovery
Want to Connect?

https://anasanjaria.bio.link/
Debugging Tools I Learned During PostgreSQL Backup Management was originally published in Level Up Coding on Medium, where people are continuing the conversation by highlighting and responding to this story.
This content originally appeared on Level Up Coding - Medium and was authored by Anas Anjaria
Anas Anjaria | Sciencx (2023-01-02T01:27:31+00:00) Debugging Tools I Learned During PostgreSQL Backup Management. Retrieved from https://www.scien.cx/2023/01/02/debugging-tools-i-learned-during-postgresql-backup-management/
Please log in to upload a file.
There are no updates yet.
Click the Upload button above to add an update.
