This content originally appeared on DEV Community 👩💻👨💻 and was authored by Hootan Hemmati
I’m getting back from cycling right now and I think about relation between car and bicycle in debugging, sounds weird but very interesting for me.
We I am cycling, I can see all the detail on my way until I arrived at my destination but when I am driving a car, I can’t see the truly detail of my way like asphalt surface or plant growing in between rocks and asphalt. In debugging we set behind the bicycle and cycling step by step in the code and when we are in release mode, we don’t want to see much detail in our way just two things are important to us, first is it must be work and second is we must arrive to our destination. So, let’s get know about some great tools in our cycling that makes our way smoother.
1. Debugging mode
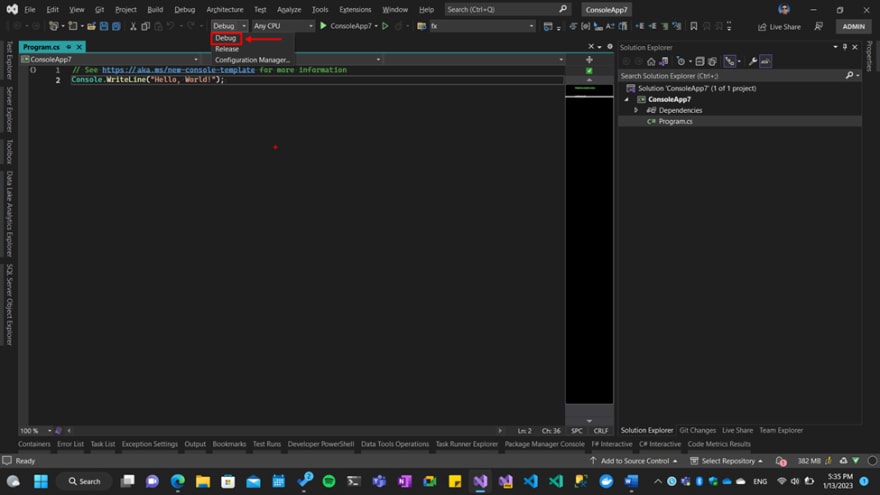
On the top of the visual studio we have 2 option for chose our journey mode. First option is Debug mode and by default it selected. In debug mode we have many options to track our code and see all the details step by step.
2. Release mode
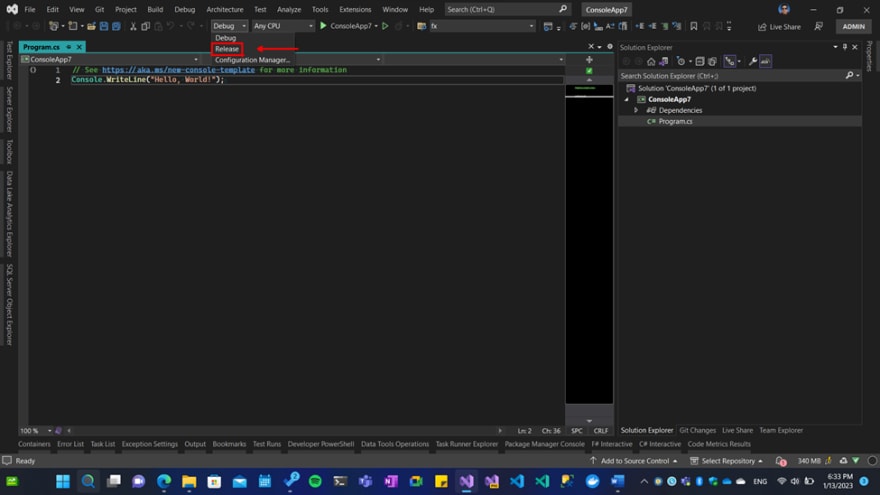
The second option is releasing mode, this mode is designed to test our app in the final version and virtualize our customers environments.
3. Breakpoints
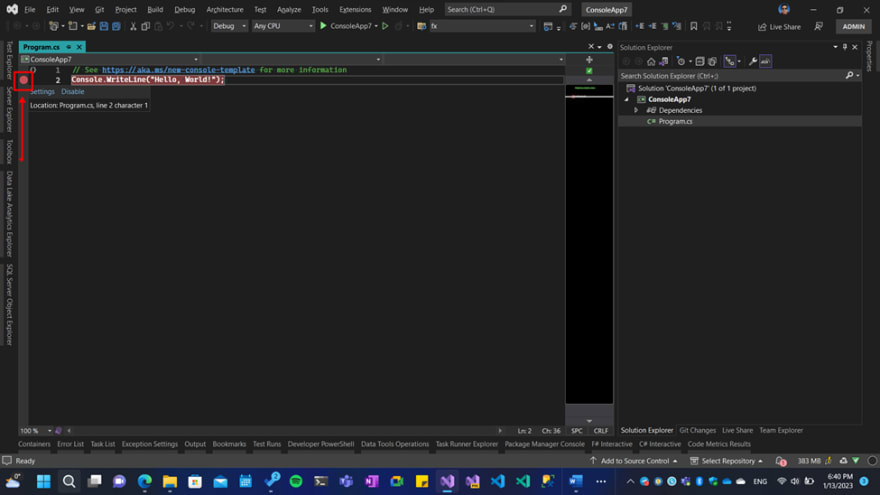
Breakpoint are our signs to what we want to check after running program.
They can be easy use by the clicking next to the line number in visual studio.
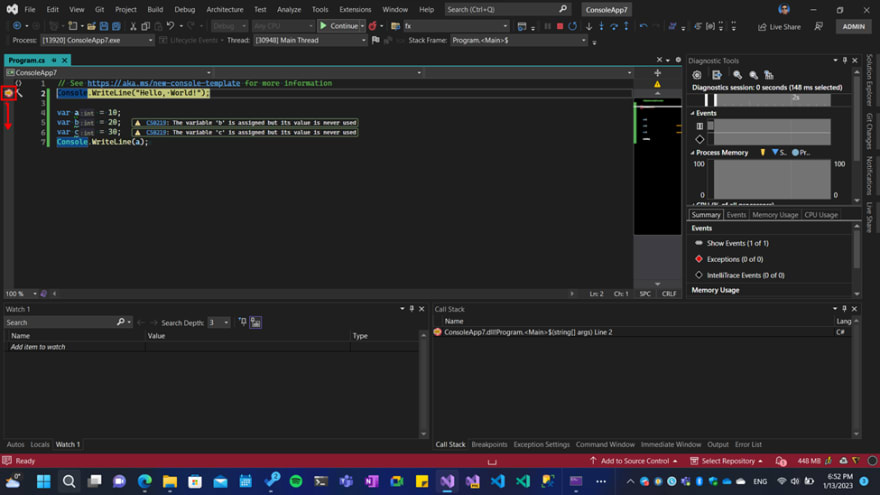
After the breakpoint is set, when we run our program in debug mode, we can see the program stop in the line we want to see the special behavior or track the code.
When the debugger arrived to our breakpoint the line color is changed to the yellow and it means that the line doesn’t execute right now but with F10 key you can execute the code. We talk about the execute code after hit breakpoints later so don’t be worry about this.
Change behavior of executed line
We can easily change our line executer (yellow arrow in the left side of code number) behavior to run what we want in the visual studio.
The first way is you can simply drag and drop the executed line at which code line you want to just executed that line.
Then you can press F10 to execute ‘’c” variable and then you can see the debugger ignore “a” and “b” variable and they default value is 0.
So that’s the easy way but let’s think about we have 1M line, dose it works in the big solutions? The answer is no but don’t be worry because the visual studio developer team developed this great feature. So, let’s learn the second way for doing this thing.
Are you ready? Just simple right clicks and chose the next statement option for going to that exact line and execute that.
Alright but if we want to run the previous line until that execute run, what can we do? Do we have any solutions? Happy to answer that question and that is yes!
Like previous situation we have two way to do that, first is just hove mouse in the specific line we want to execute with the previous code lines and select the green run (play) button.
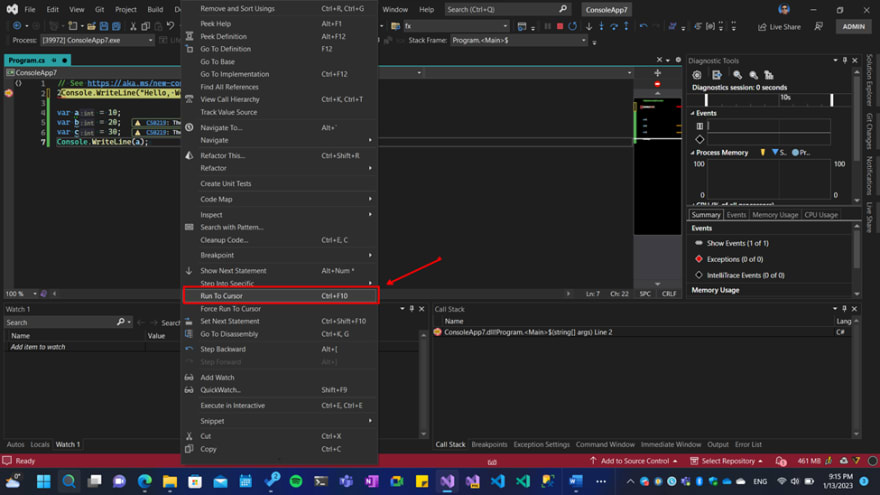
The second way is simply right click on the execute line you want then just chose the run to cursor option.
In the next part of this series of article we read about how to step in to our code (like F10 and F11) and then we go deeply in to the breakpoints feature like condition breakpoints.
I hope you like this collection of my articles and enjoy that.
This content originally appeared on DEV Community 👩💻👨💻 and was authored by Hootan Hemmati
Hootan Hemmati | Sciencx (2023-01-13T18:30:32+00:00) Debugging in .NET apps using Visual Studio Part 1. Retrieved from https://www.scien.cx/2023/01/13/debugging-in-net-apps-using-visual-studio-part-1/
Please log in to upload a file.
There are no updates yet.
Click the Upload button above to add an update.

