This content originally appeared on DEV Community 👩💻👨💻 and was authored by Matt Angelosanto
Written by Shalitha Suranga✏️
A software bug is a programming error or the unexpected behavior of a software program. Debugging refers to the process of inspecting and removing bugs in software systems. Programmers use various techniques for debugging; some developers write outputs to the terminal, while others use debugger tools to execute and monitor source code.
The Google Chrome web browser offers an inbuilt debugger with the DevTools module for debugging JavaScript. Chrome DevTools implements support for source maps and can inspect both Node.js and Deno debugger instances. So, whether you use TypeScript in a client-side app (i.e., a TypeScript-based React app) or in a server-side app, you can use Chrome for debugging.
In this tutorial, I will explain how to debug client-side and server-side TypeScript code in Chrome. We’ll cover:
- How Chrome DevTools lets you debug TypeScript
- Debugging any TypeScript file: Manual configuration
- Debugging in frontend frameworks: Automatic configuration
- Integrating VS Code for frontend debugging
- Debugging TypeScript backend code
- Debugging TypeScript-based Node.js apps
- Debugging Deno apps
- Integrating VS Code for backend debugging
How Chrome DevTools lets you debug TypeScript
Web browsers have inbuilt support for JavaScript and WebAssembly , but not for TypeScript. So, how can we debug TypeScript in Chrome if it doesn’t natively execute TypeScript? Chrome and all standard web browsers support processing JavaScript source maps.
A JavaScript source map typically maps a particular form of a specific JavaScript source code to a JavaScript source code the browser executes. For example, it’s hard to debug a minified JavaScript file in the browser, but if you use a source map, you can easily debug the readable JavaScript file while executing its minified version. Similarly, you can debug a TypeScript file when you run its transpiled JavaScript version in Chrome.
The official TypeScript compiler, tsc, can generate source maps during the transpilation process, so now we can write TypeScript code, transpile to JavaScript along with a source map, and debug TypeScript code in the browser while executing the transpiled JavaScript code.
Server-side runtimes like Node and Deno, where we can run JavaScript/TypeScript, listen to Chrome DevTools debugger events via v8. This is how we can debug server-side TypeScript code in Chrome!
Debugging any TypeScript file: Manual configuration
When you use frontend frameworks to build your apps, their TypeScript templates typically come with pre-included TypeScript compiler configurations and automatically generate source maps for you. But in some scenarios, we have to configure the TypeScript compiler, generate our own source maps, and manually link our transpiled TypeScript files using the HTML script tag.
This is a great way to learn how to debug TypeScript in Chrome because that manual configuration and setup helps us understand the TypeScript debugging internals. Let’s prepare a development environment to debug any client-side TypeScript file in Chrome.
First, create a new npm project in any directory you like, as follows:
npm init
# --- or ---
yarn init
Next, install the typescript package:
npm install typescript
# --- or ---
yarn install typescript
Now, generate the TypeScript compiler configuration file:
npx tsc --init
The default configuration won’t enable source map generation, so we need to edit the auto-generated configuration file. Uncomment the following line in tsconfig.json to enable source map generation:
"sourceMap": true,
Add an npm script to generate JavaScript by modifying your package.json:
"scripts": {
  "build": "npx tsc"
},
Now, we can use either the npm run build or yarn build command to transpile TypeScript files. We’ll debug the following TypeScript code:
function sayHello(name: string): void {
    let message = `Hello ${name}!`;
    console.log(message);
    if(name == 'TypeScript') {
        console.log('.ts');
    }
    else if(name == 'JavaScript') {
        console.log('.js');
    }
}

sayHello('TypeScript');
sayHello('JavaScript');
Add the above code into main.ts. Next, use main.js in index.html:
<script src="./main.js"></script>
Generate main.js and main.js.map (our source map) with the following command:
npm run build
# --- or ---
yarn build
Serve the web content in http://localhost:3000 with the following command:
npx serve
The above code starts a static server (Vercel’s serve) in port 3000. Open the URL in Chrome, open the DevTools, and click the Source tab. You’ll see main.ts as follows: 
Try to add a breakpoint and reload the app. You can debug TypeScript just as you debug JavaScript in Chrome: 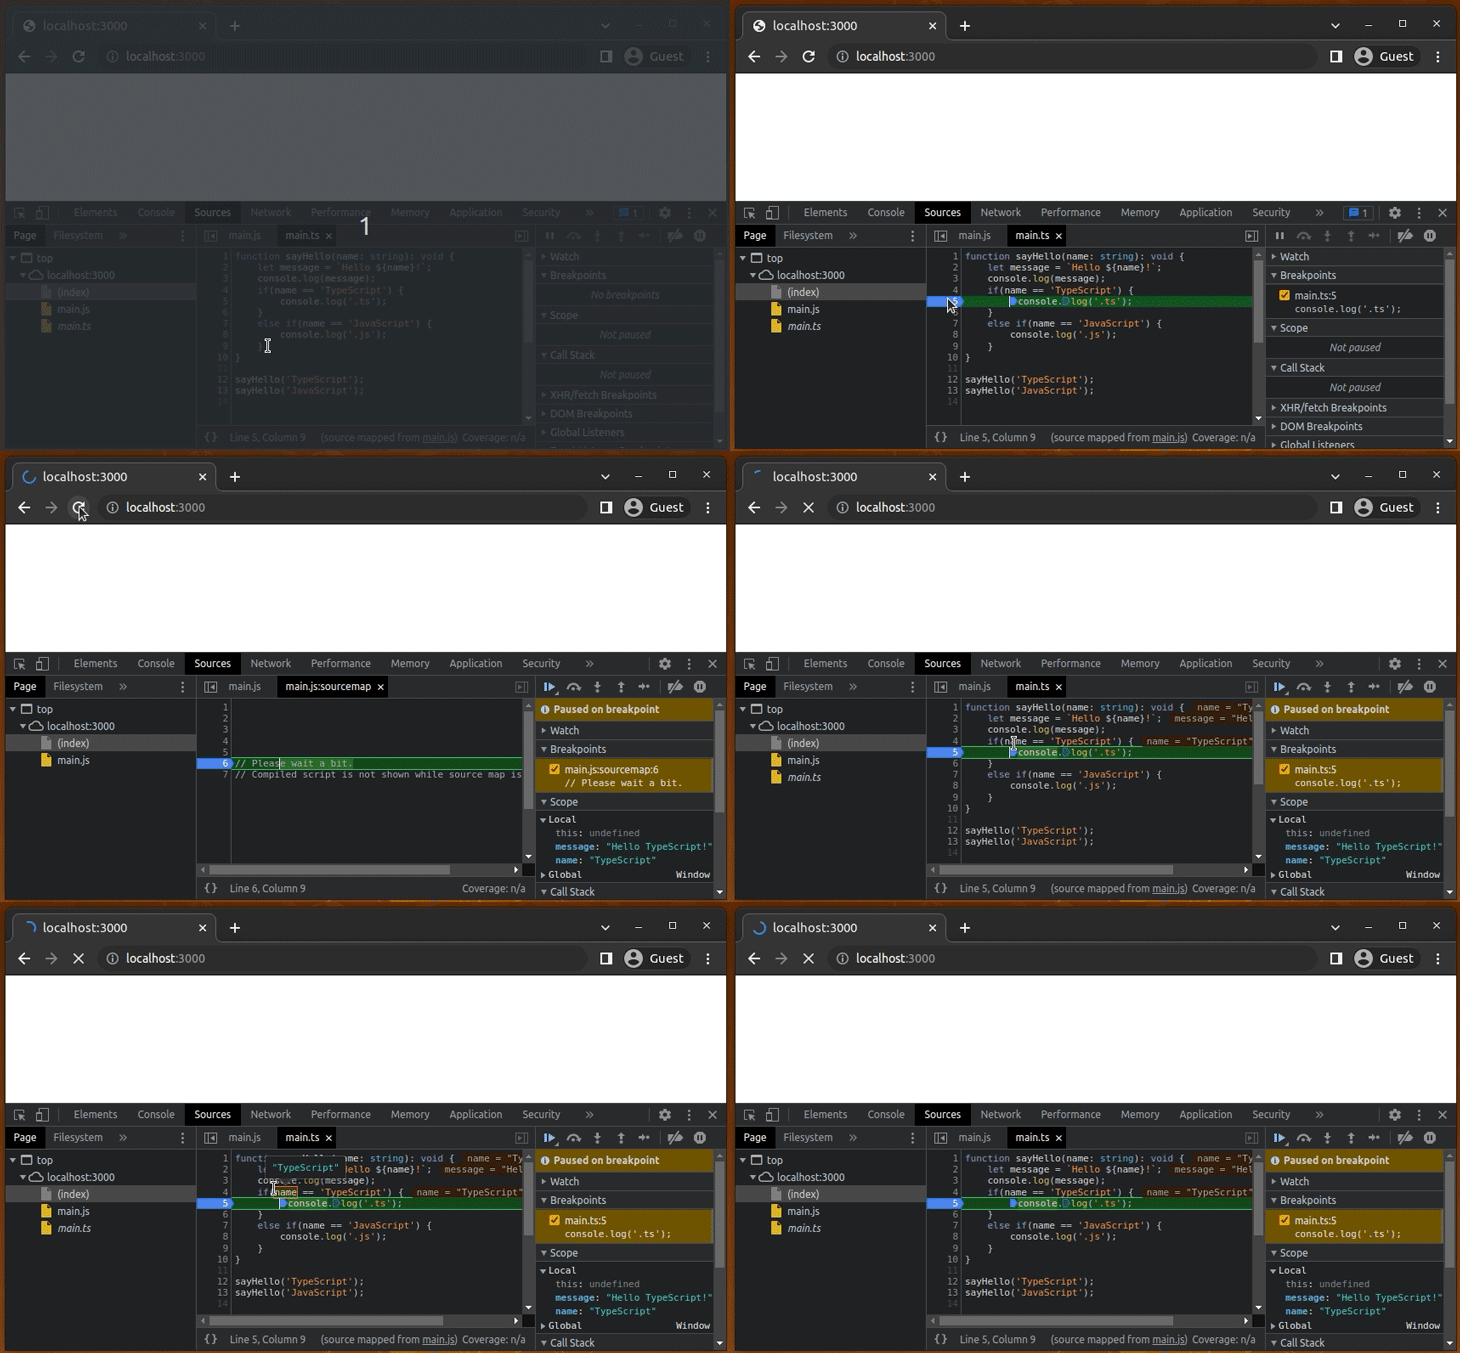
Chrome loads the source map automatically, since the TypeScript compiler appends the source map filename to main.js:
//# sourceMappingURL=main.js.map
The debugger keyword also works with TypeScript debugging. Add debugger after the console.log(message); statement and reload the app: 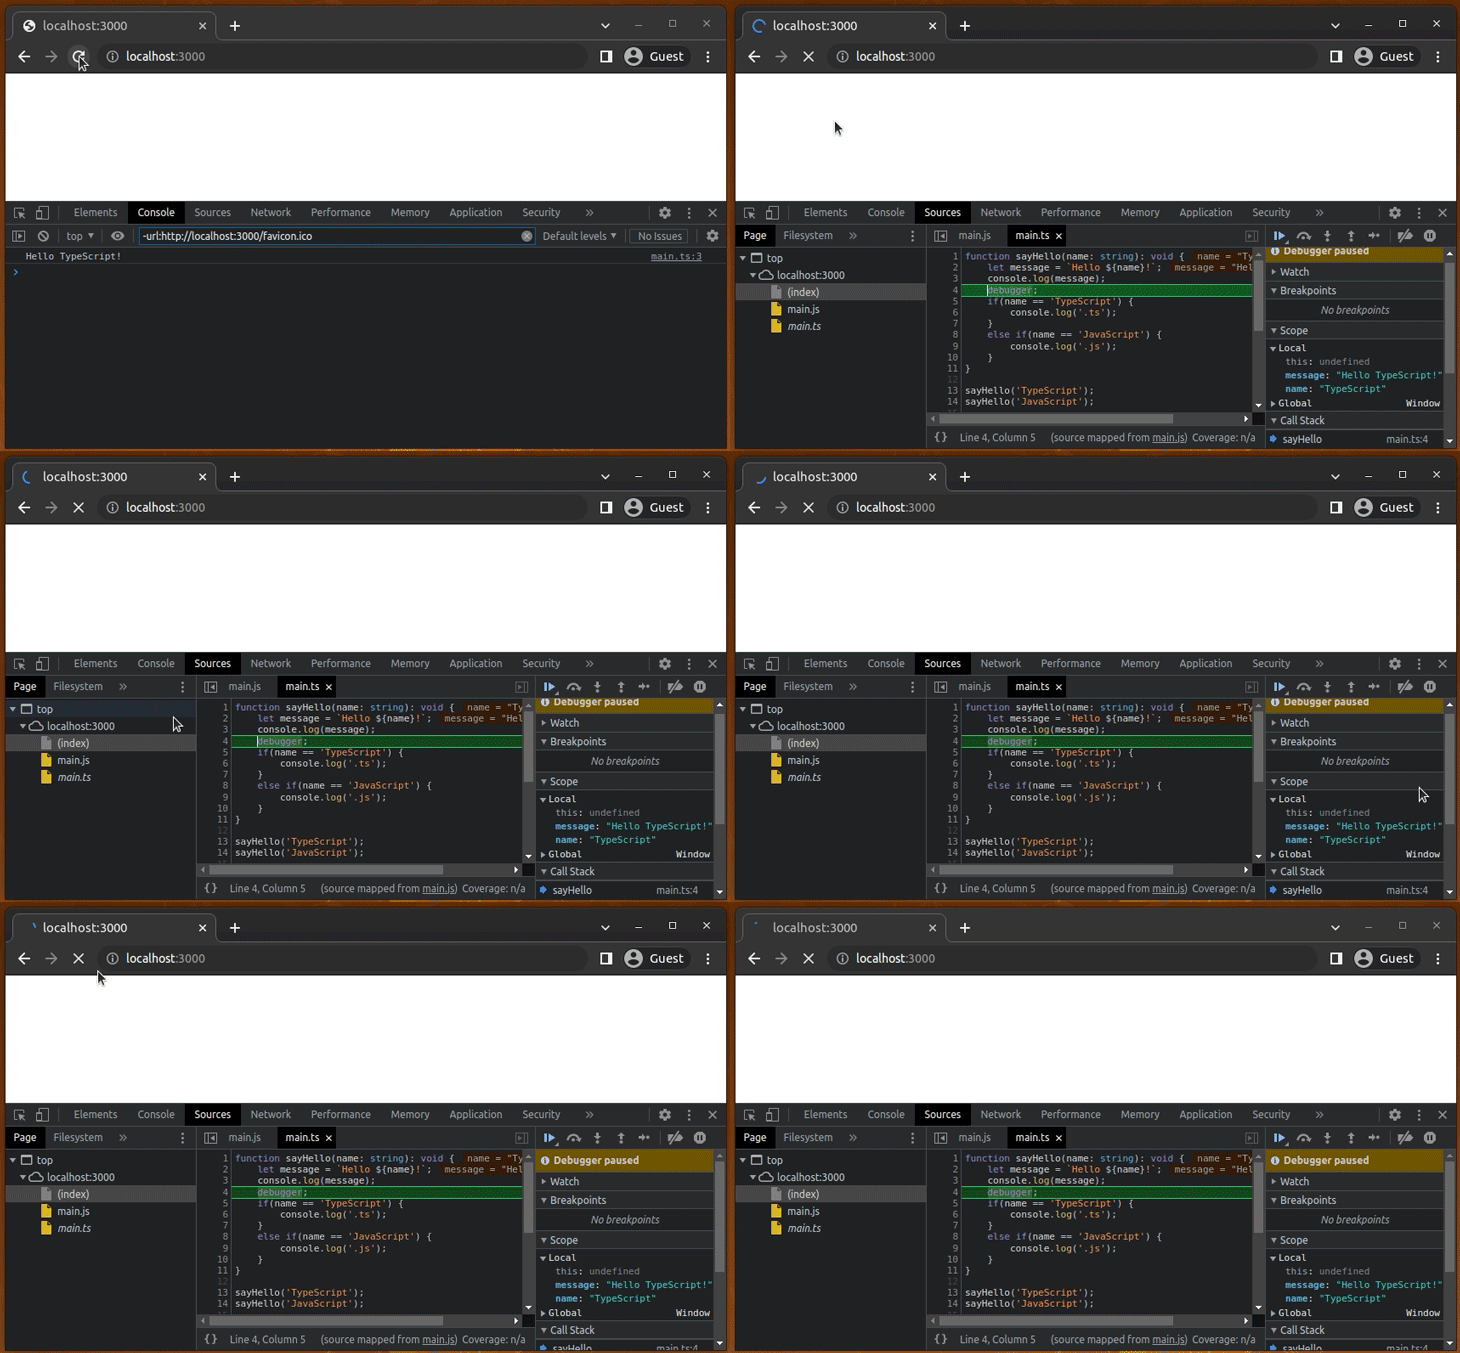
For experimentation purposes, try removing the source map file (main.js.map) and debugging main.ts. The main.ts file will disappear from the source panel because TypeScript debugging works based on source maps.
With this approach, it’s possible to debug TypeScript code bundled with either webpack or Rollup. You can enable debugging TypeScript in Chrome by adding an auto-generated source map to your web directory.
Debugging in frontend frameworks: Automatic configuration
Earlier, we learned how TypeScript debugging works in Chrome by using a manual configuration. But as we mentioned, almost all frontend frameworks/libraries offer pre-implemented TypeScript templates, which typically include compiler configurations to generate source maps. These make it so that when you run your app in developer mode, TypeScript debugging is automatically enabled in Chrome.
Now, we’ll create a React app with Create React App’s official TypeScript template to learn how to debug TypeScript apps built with modern frontend frameworks. Run the following command to create a new TypeScript-React app:
npx create-react-app my-app --template typescript
#--- or ---
yarn create react-app my-app --template typescript
Now, add the following code to your App.tsx file:
import React, { useState } from 'react';
import './App.css';

function App(): JSX.Element {
  const [message, setMessage] = useState('');

  function generateMessage(name: string): string {
    let message: string = `Hello ${name}!`;
    return message;
  }

  function handleClick(): void {
    setMessage(generateMessage('TypeScript'));
  }

  return (
    <div>
      <div>{message}</div>
      <button onClick={handleClick}>Say hello</button>
    </div>
  );
}

export default App;
The above code renders a greeting message when we click the Say hello button. Run the project with the following commands to start debugging TypeScript:
npm start
# --- or ---
yarn start
Assume that you need to set up a breakpoint for line 8 of App.tsx. Since we have multiple source files, we can easily navigate to App.tsx by pressing Control+P: 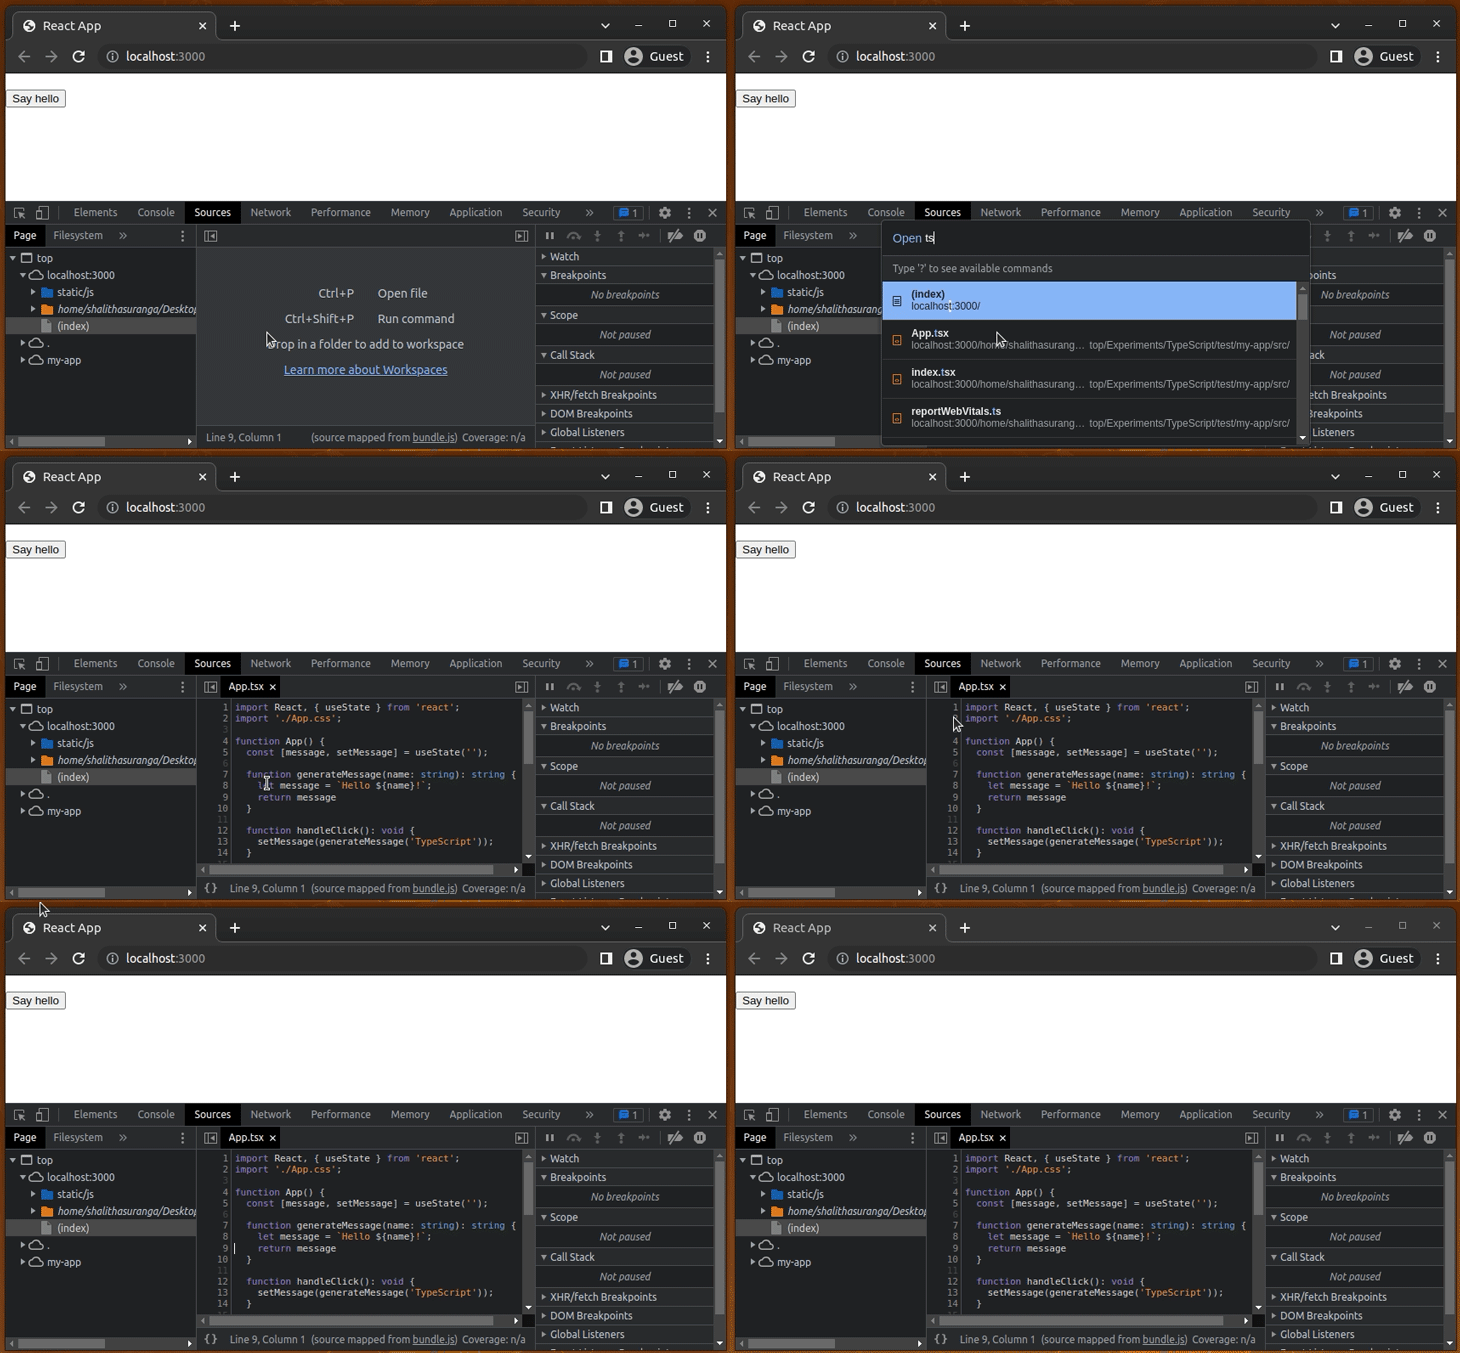
Now, set up the breakpoint and click the button. The DevTools debugger works as expected for TypeScript: 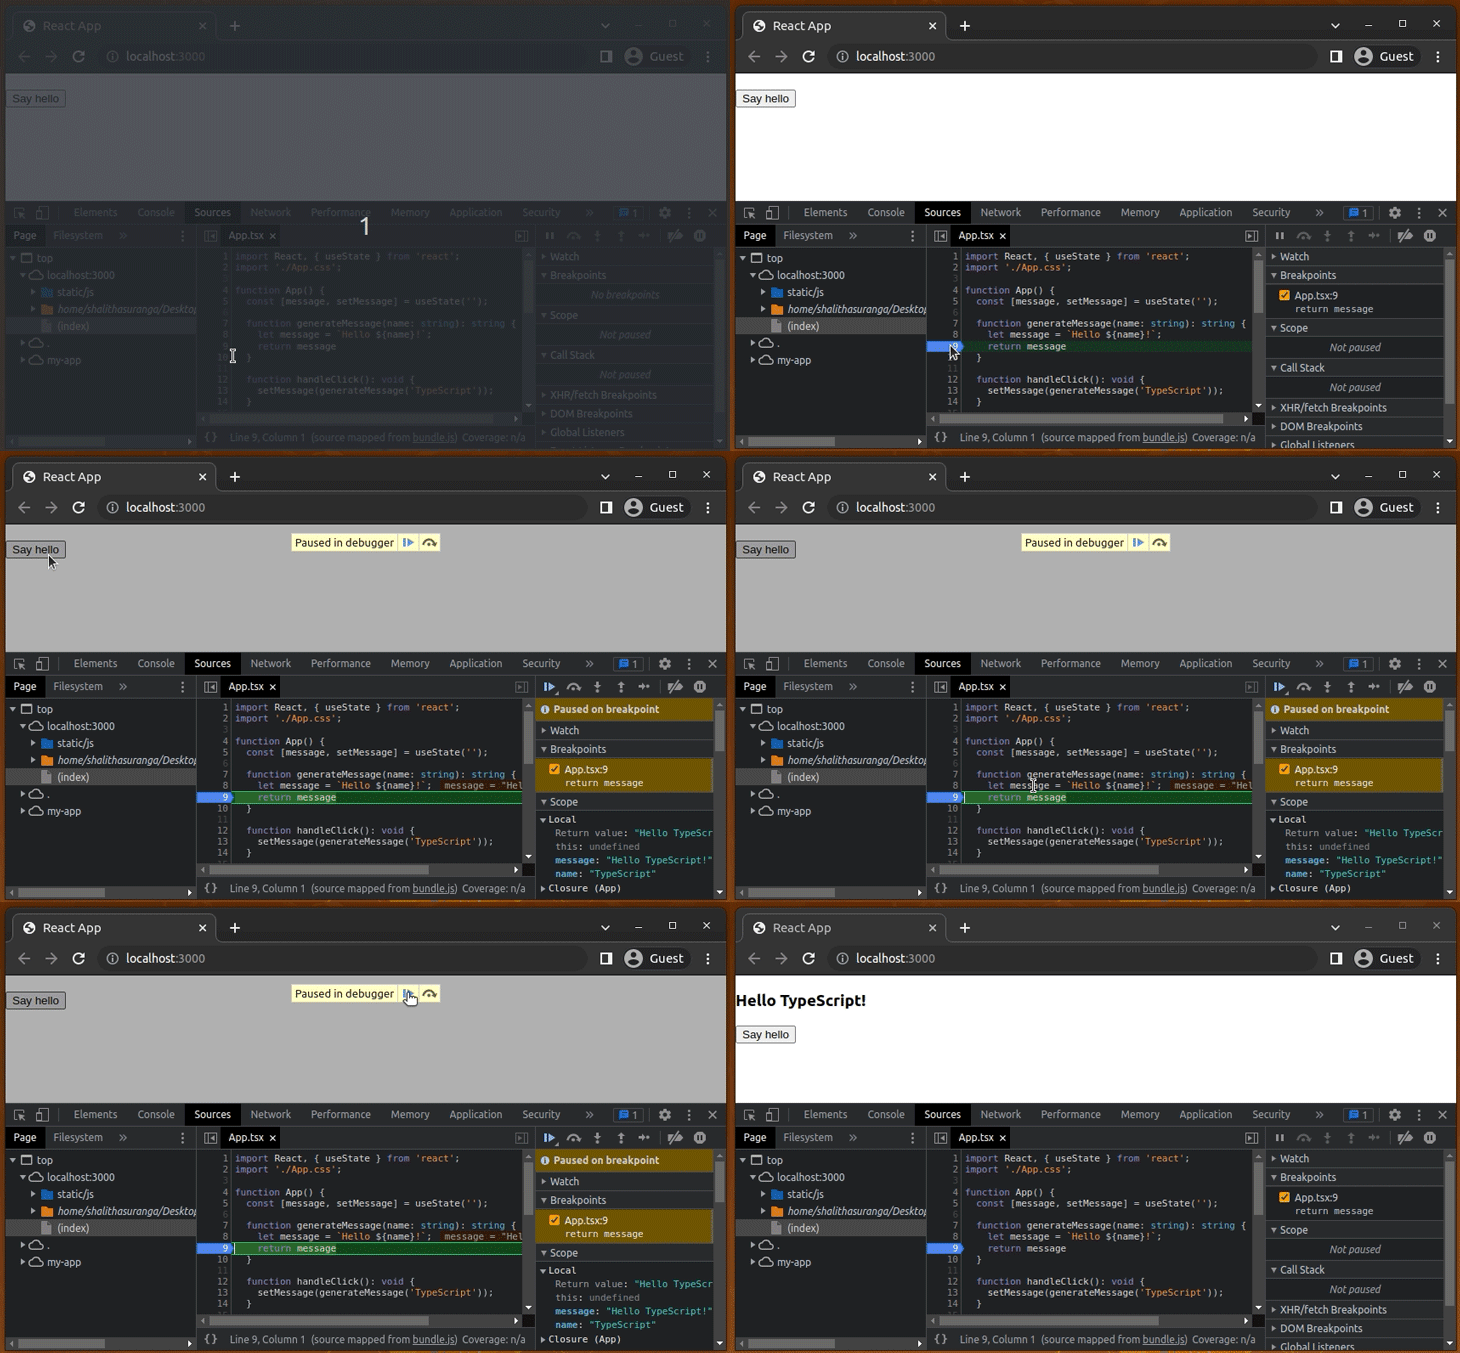
Try to use the Call stack section to monitor TypeScript function calls: 
Every debugger feature works for TypeScript debugging because of source maps. The React scripts module does real-time TypeScript compilation, so you can fix TypeScript programming errors by checking Chrome or your terminal.
Let’s send an integer to the generateMessage function just for experimental purposes:
function handleClick(): void {
  setMessage(generateMessage(1));
}
Now, you will see TypeScript compilation errors on Chrome and the terminal: 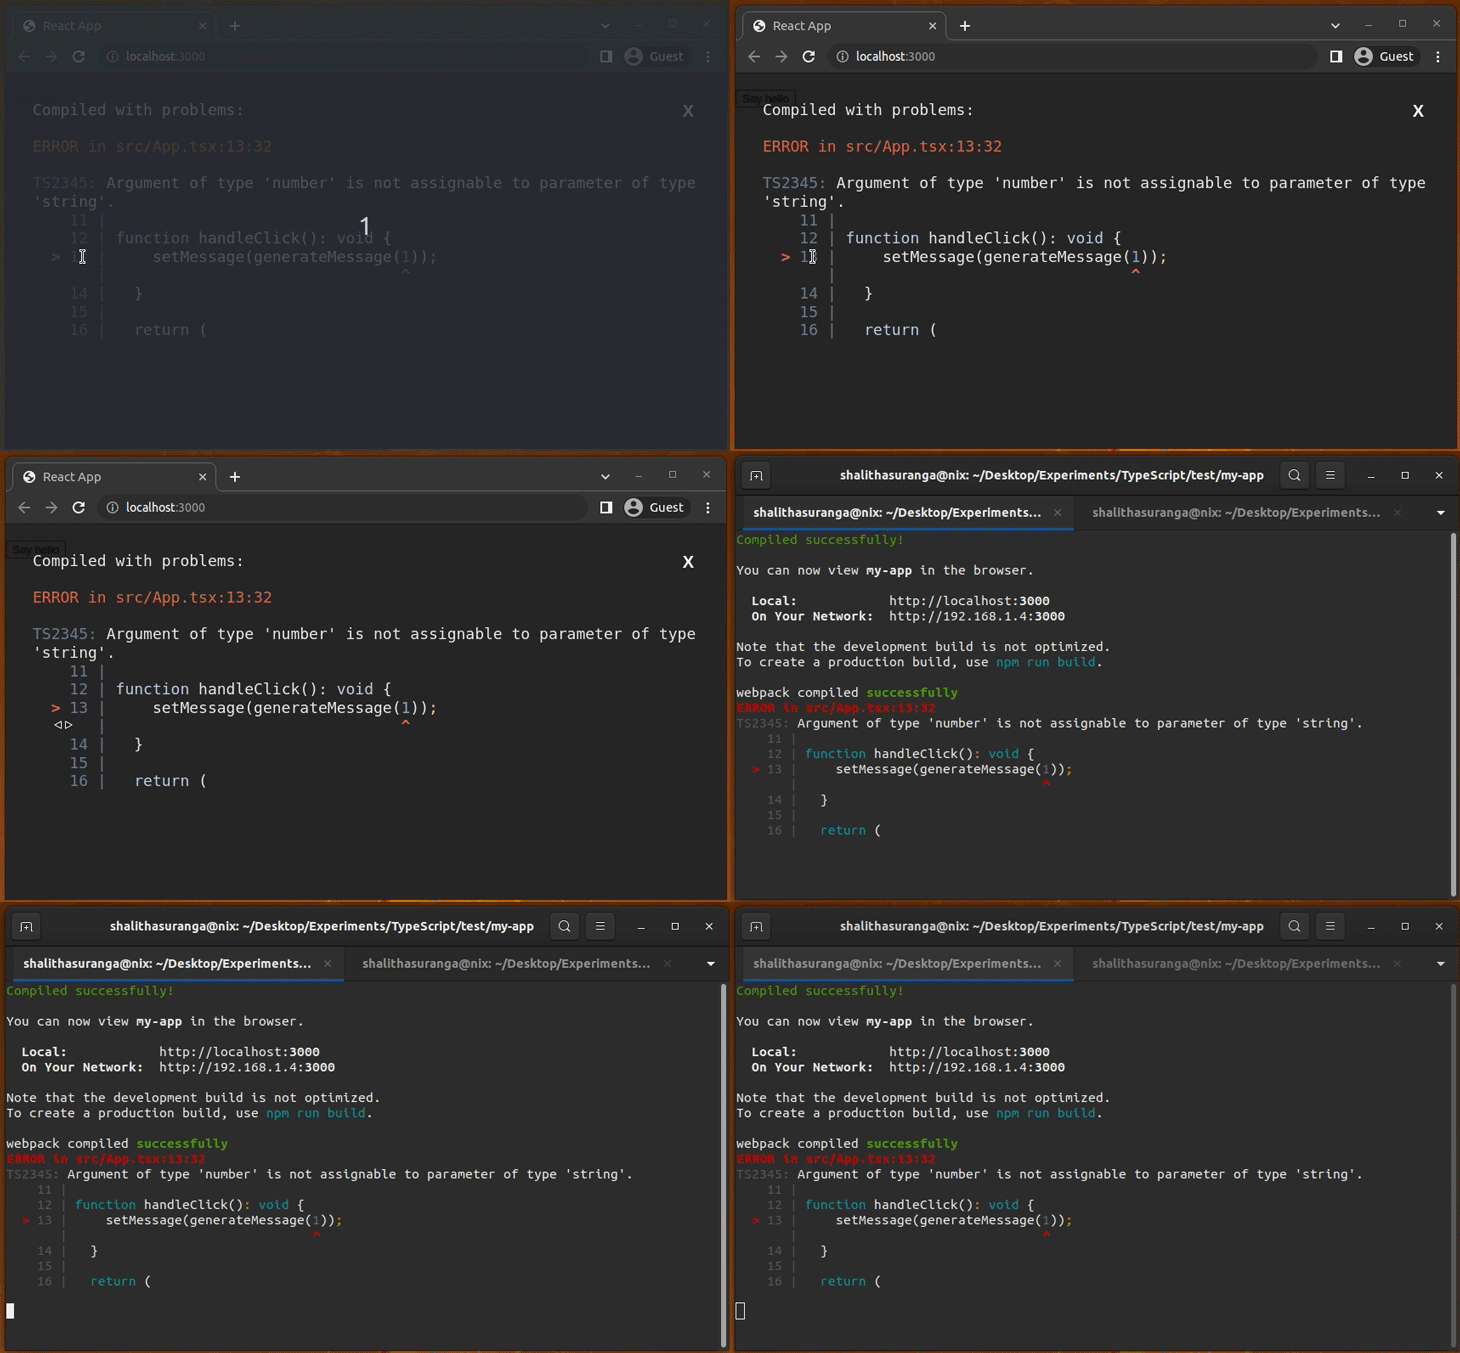
All popular frontend frameworks, such as Angular, Vue, Svelte, etc., offer TypeScript development support and generate JavaScript source maps automatically. So, debugging TypeScript becomes really easy when using frontend framework tooling.
Integrating VS Code for frontend debugging
If you use VS Code to write code, you can use the editor UI as the debugger interface instead of Chrome DevTools. VS Code offers inbuilt support for debugging JavaScript/TypeScript via the JavaScript debugger extension, which comes pre-installed.
Start your web development server (i.e., webpack development server) and launch Chrome with the following launch.json setup:
{
    "version": "0.2.0",
    "configurations": [
        {
            "type": "chrome",
            "name": "Chrome",
            "request": "launch",
            "url": "http://localhost:3000"
        }
    ]
}
When you press F5 and start debugging, you can set up breakpoints from the editor. For example, see how I debug App.tsx: 
Debugging TypeScript backend code
You can use TypeScript to write your Node.js and Deno backend projects. Let’s discuss how to use Chrome to debug them.
Debugging TypeScript-based Node.js apps
As with client-side TypeScript development, we’ll have to transpile TypeScript into JavaScript before executing the project with the Node.js runtime. Client-side JavaScript execution uses Chrome’s inbuilt v8 JavaScript engine, so we could directly use the DevTools debugger as we did before, but the Node.js runtime uses its own v8 instance, so it offers an inbuilt debugger tool as it can’t use Chrome’s debugger/JavaScript execution environment directly.
Create a new npm project and a TypeScript configuration file (with source maps enabled) using the same steps we followed in client-side debugging. Next, add the following code to main.ts:
function sayHello(name: string): void {
    let message: string = `Hello ${name}!`;
    console.log(message);
    if(name == 'TypeScript') {
        console.log('.ts');
    }
    else if(name == 'JavaScript') {
        console.log('.js');
    }
}

sayHello('TypeScript');
sayHello('JavaScript');
Add the following scripts to your package.json file:
"scripts": {
  "build": "npx tsc",
  "debug": "node inspect main.js"
},
Generate the JavaScript file and source map:
npm run build
# --- or ---
yarn build
Next, start the Node.js debugger with the following command:
npm run debug
# --- or ---
yarn debug
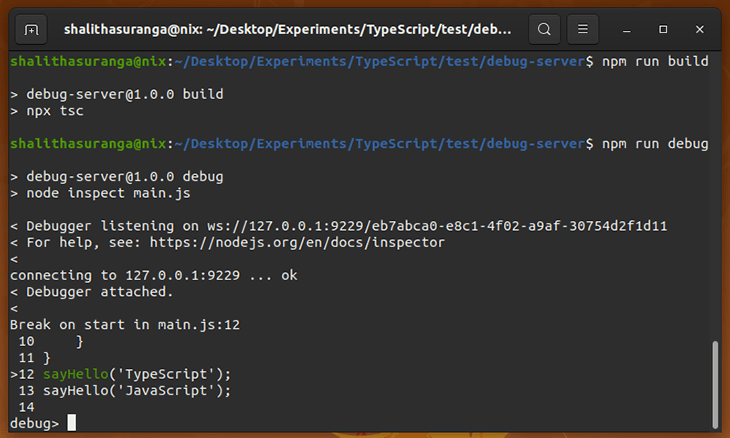
The above npm script initializes the inbuilt Node.js debugger utility and starts listening to Chrome DevTools protocol messages via WebSockets. So, we can either use the inbuilt Node.js debugger utility via the command line or the GUI debugger via Chrome DevTools.
Once you run the above command, the debugger automatically sets a breakpoint to the first executable statement, as follows:
The inbuilt debugger doesn’t support TypeScript debugging because it doesn’t understand source maps — it is only a minimal debugger that comes with several commands. For example, you can use the following commands to set a breakpoint in line 5 and stop the code execution at the newly-added breakpoint:
sb(5)
c
You can check out all of the inbuilt debugger commands in the official documentation. We won’t discuss the inbuilt debugger further, since our focus is on the Chrome debugger in this tutorial.
Let’s debug this TypeScript project in Chrome. Run the project with the debug npm script and go to the following URL on Chrome:
chrome://inspect
Now, open the DevTools debugger GUI as follows: 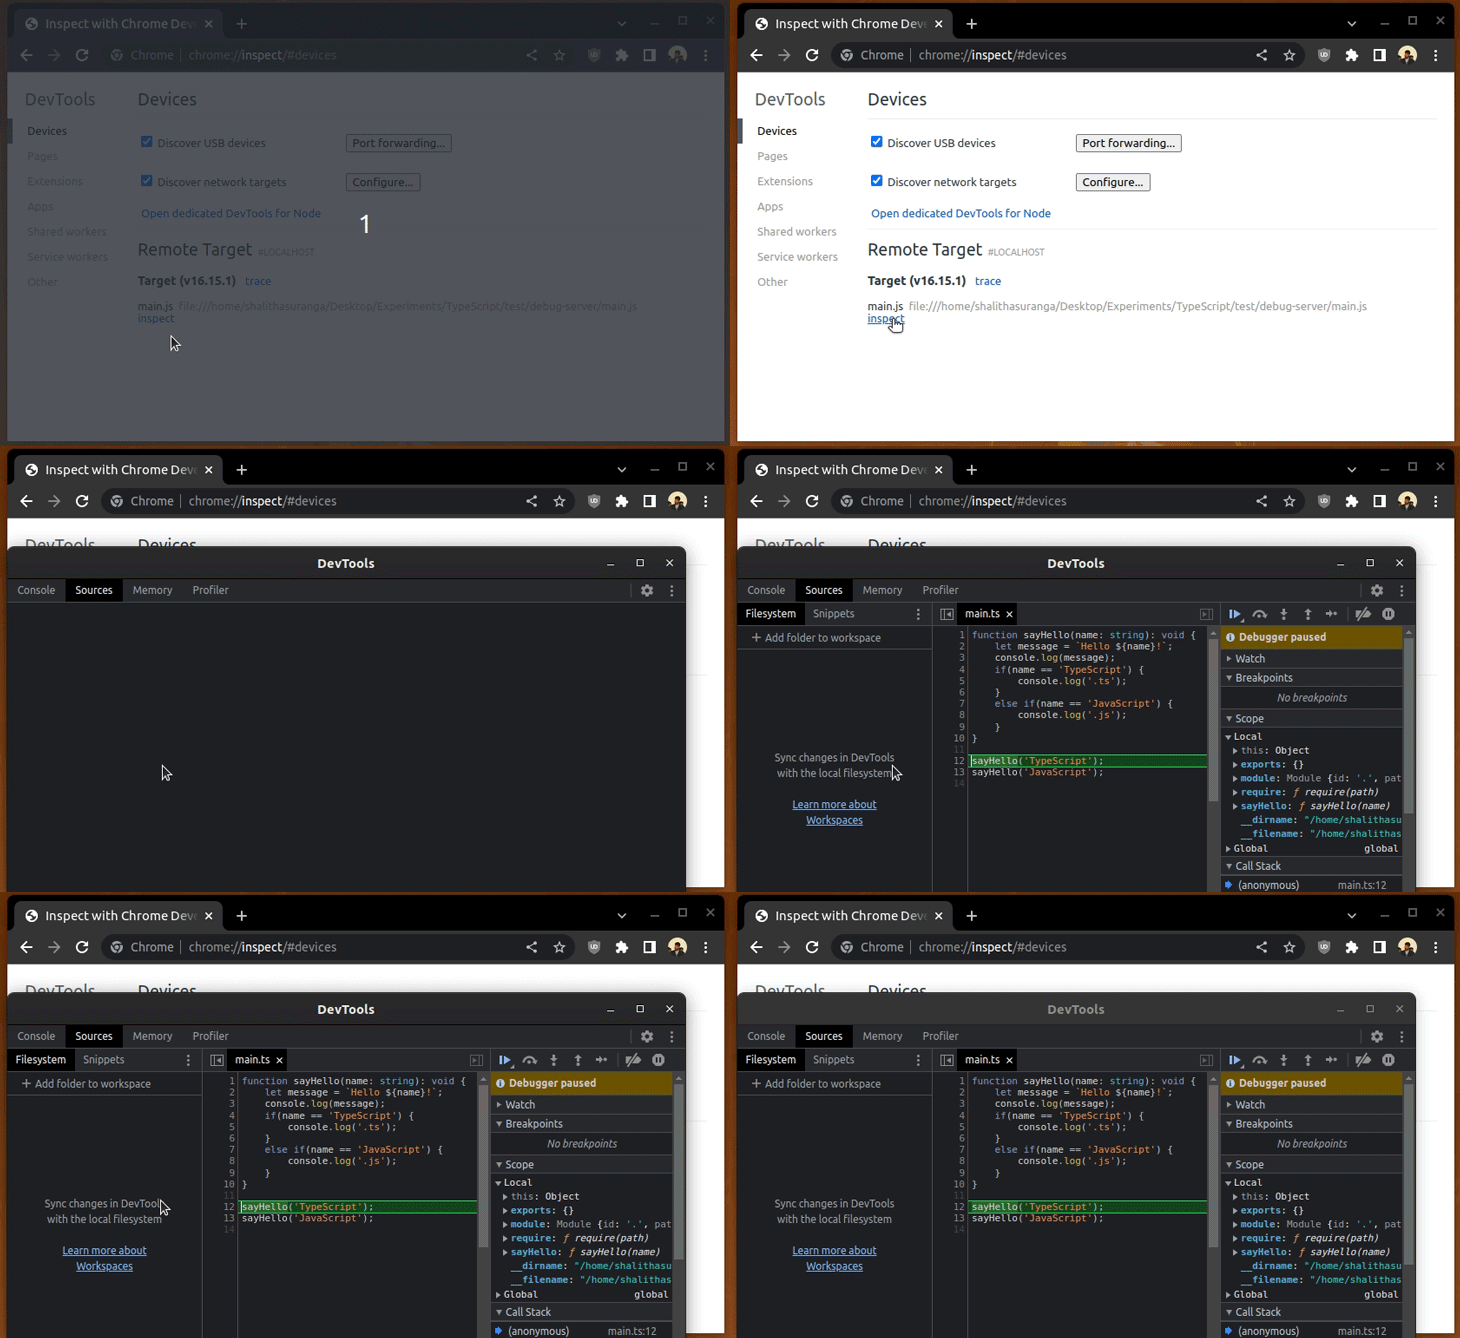
You can debug the TypeScript file via the Chrome DevTools interface. The debugger utility reflects your debugging actions on the terminal. Look at the following preview:
Earlier, the sample React project re-transpiled modified TypeScript code during code changes. You can do the same for server-side TypeScript projects with tsc --watch and nodemon or ts-node-dev.
Debugging Deno apps
Deno is a secure TypeScript runtime that we can use as an alternative to the Node.js runtime. Debugging TypeScript in Deno doesn’t require manual configuration the way TypeScript-based Node.js apps do, since Deno natively supports TypeScript.
First, make sure that you already have Deno installed on your computer. If not, install the latest Deno runtime version according to the official installation guide.
Start the Deno debugger with the following command in the TypeScript-based Node.js project directory we created earlier:
deno run --inspect-brk main.ts
Then, open DevTools and start debugging: 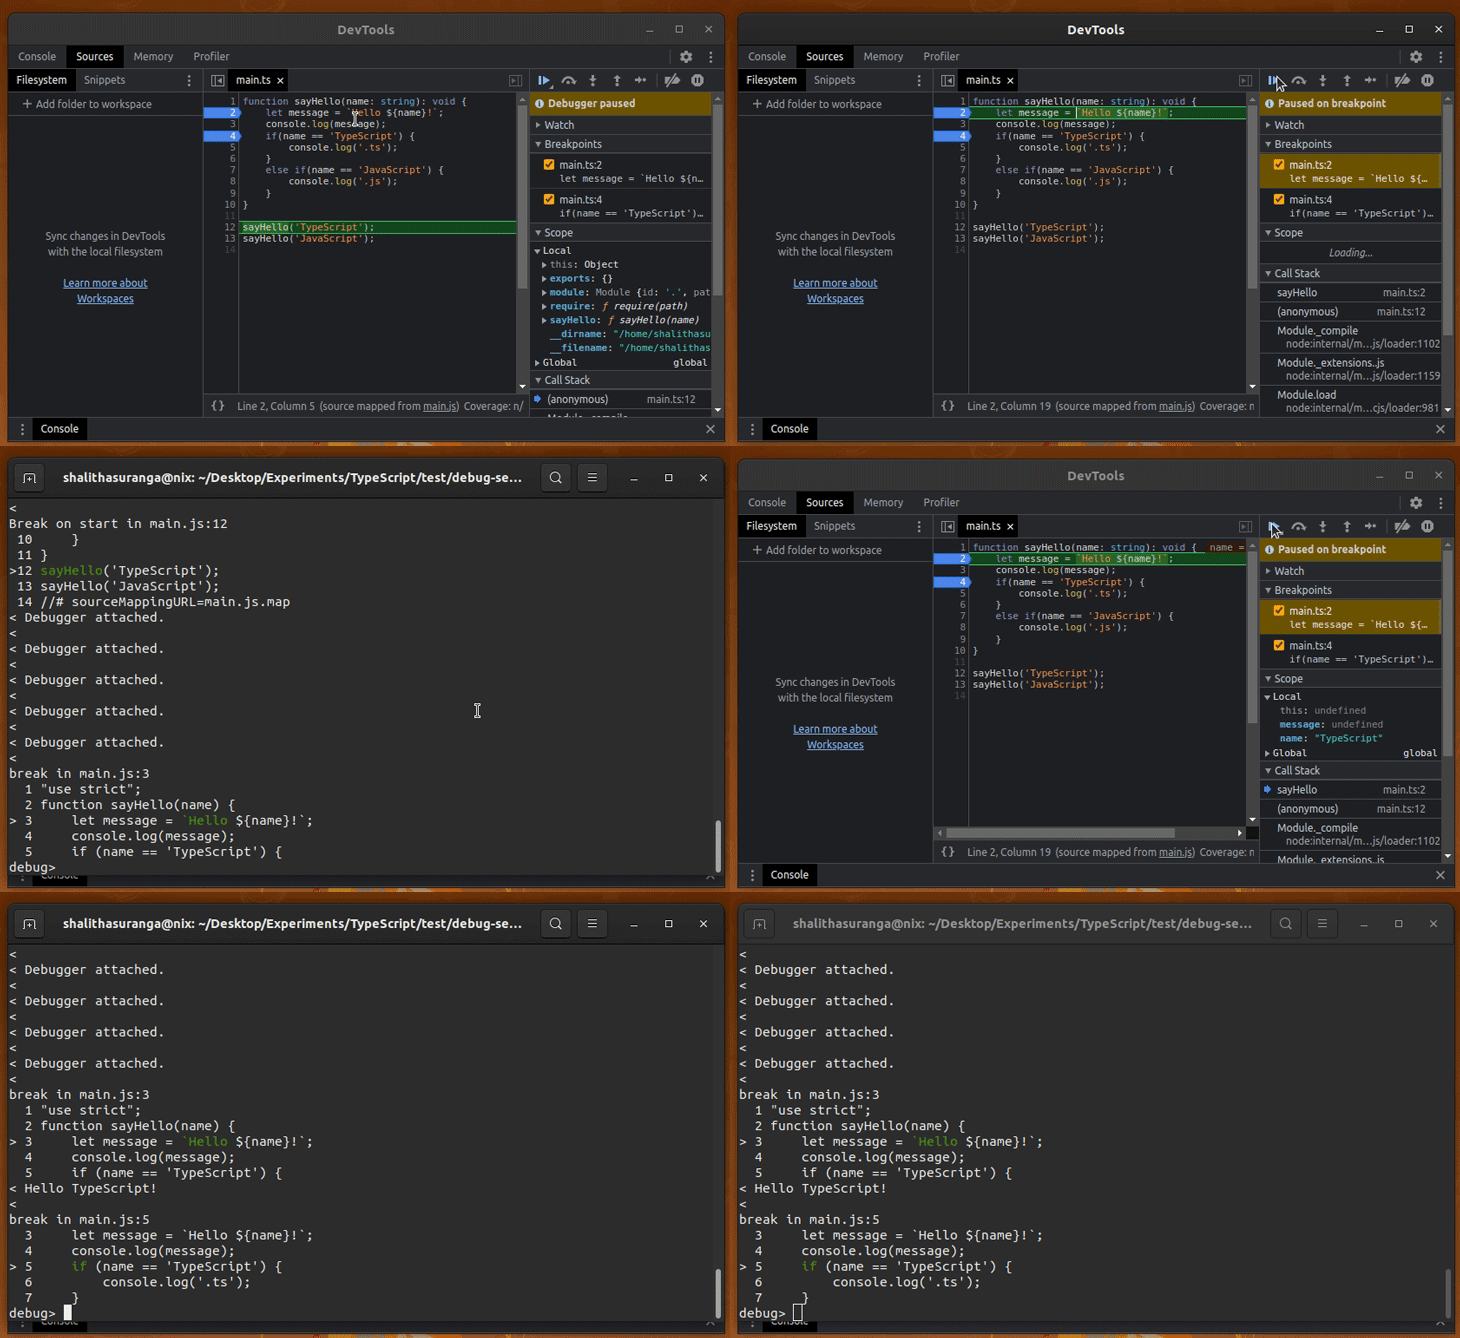
Integrating VS Code for backend debugging
You can press F5 and debug Node.js apps without extra extensions because the inbuilt debugger extension supports Node.js debugging.
For Deno, you can either install the Deno extension for automatic launch.json configuration, or manually use the following launch.json setup:
{
    "version": "0.2.0",
    "configurations": [
      {
        "name": "Deno",
        "type": "node",
        "request": "launch",
        "cwd": "${workspaceFolder}",
        "runtimeExecutable": "deno",
        "runtimeArgs": ["run", "--inspect-brk", "-A", "${file}"],
        "attachSimplePort": 9229
      }
    ]
 }
See how I debug a TypeScript file with VS Code: 
Conclusion
The main goal of debugging is to identify software bugs by monitoring source code execution and manually reviewing code. In most web development debugging activities, we can identify bugs by reading the code and using well-known debugger utility features. But, in some complex scenarios, we have to generate many test cases and use advanced debugger features.
Most web developers use the standard Console API (i.e., console.log) for debugging purposes; others start with the Chrome DevTools debugger or VS Code’s debugger UI. When you start tracing a bug, start by analyzing the code from top to bottom. If you haven’t found the bug, then try to log runtime values if the logical flow is not complex. If the logical flow is complex, starting with Chrome debugger or VS Code debugger UI saves you time.
In this tutorial, we discussed how to use Chrome for debugging your browser, Node.js, and Deno apps written in TypeScript. We also discussed how to use VS Code’s debugger UI.
You can customize and use these debugging techniques according to your requirements and personal preferences. Similar to frontend frameworks’ TypeScript templates, you can use the node-typescript-boilerplate template to create a TypeScript-based Node.js project faster with a pre-configured debugging environment. Or, you can create your own template with the steps we discussed in this tutorial.
LogRocket: Full visibility into your web and mobile apps
LogRocket is a frontend application monitoring solution that lets you replay problems as if they happened in your own browser. Instead of guessing why errors happen, or asking users for screenshots and log dumps, LogRocket lets you replay the session to quickly understand what went wrong. It works perfectly with any app, regardless of framework, and has plugins to log additional context from Redux, Vuex, and @ngrx/store.
In addition to logging Redux actions and state, LogRocket records console logs, JavaScript errors, stacktraces, network requests/responses with headers + bodies, browser metadata, and custom logs. It also instruments the DOM to record the HTML and CSS on the page, recreating pixel-perfect videos of even the most complex single-page and mobile apps.
This content originally appeared on DEV Community 👩💻👨💻 and was authored by Matt Angelosanto
Matt Angelosanto | Sciencx (2023-02-03T14:18:28+00:00) How to debug TypeScript in Chrome. Retrieved from https://www.scien.cx/2023/02/03/how-to-debug-typescript-in-chrome/
Please log in to upload a file.
There are no updates yet.
Click the Upload button above to add an update.

