This content originally appeared on DEV Community 👩💻👨💻 and was authored by Hootan Hemmati
After fantastic snow in Tehran on the 12 February morning I'm writing my second part of Debugging in .Net.
Ok, let's think about snow and snowball, the snowball is round, and we shoot them to another.
Did you ever use breakpoints? If you do not, don't worry about that because we want to learn it from here.
Breakpoints are like a snowball, their circle, and we shoot in our program to stop right there and give us a look at what happens at our destination.
In the previous article, I explained breakpoints in basic, but here we want to do some cool stuff and learn new things in breakpoints.
Steps in Breakpoints
Looking at the top of the visual studio, you see the number of arrow icons. They are step arrows in our application (but keep it secret🤭).
Let's dive into our arrows and see what they are.
From left to right in the above picture, we have
- show next statement
- step in to (F11 keyboard shortcut key)
- step over (F10 keyboard shortcut key)
- step out (Shift + F11 keyboard shortcut key)
- step backward
- step forward
Show next statement: this action button moves your cursor to where the following line wants to execute.
Step in to: move you deeply into code when you have a method in your code. If you select this action button, it goes to the first line of the target method we want.
Step over: Like its name, it jumps over the extra detail in our specific block code. Like the previous example, if we select this action button, we jump from the method in the code and continue debugging after the method.
Step out: if we want to go out of our method, we use to step out to do this.
Step backward: go back to the previous step line.
Step forward: go forward to the last step line.
View results and different face shapes
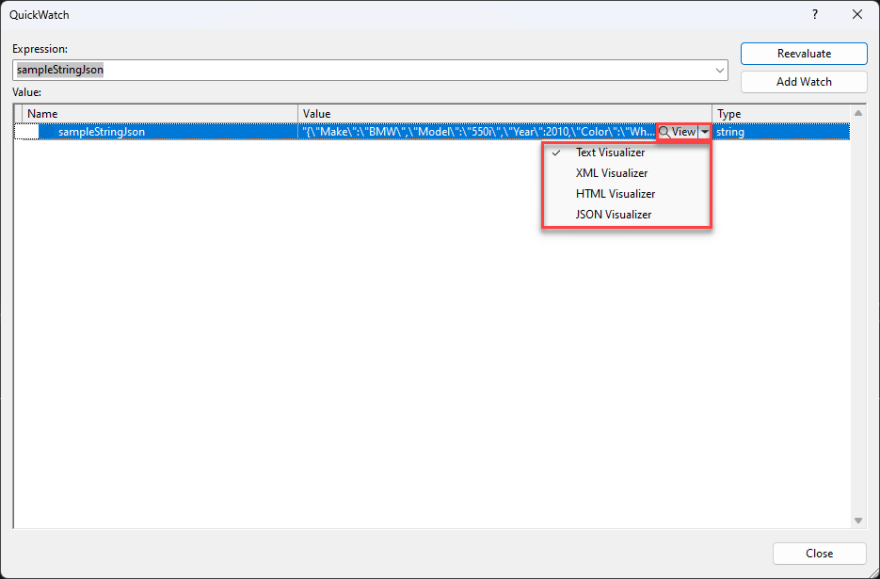
When we debug our application and hover over variables, we see a little icon of the variable with the inside value.
This tool is called view result, which is our magnifier to analyze our variable to what's inside it.
With the magnifier icon side of it, we can see the detail of what we have in our variable in a large window.
We have an option inside of our magnifier, and it is called text. When we hover over that, we can see the options to choose from and determine what type we want our big window to show us.
Edit and continue debugging
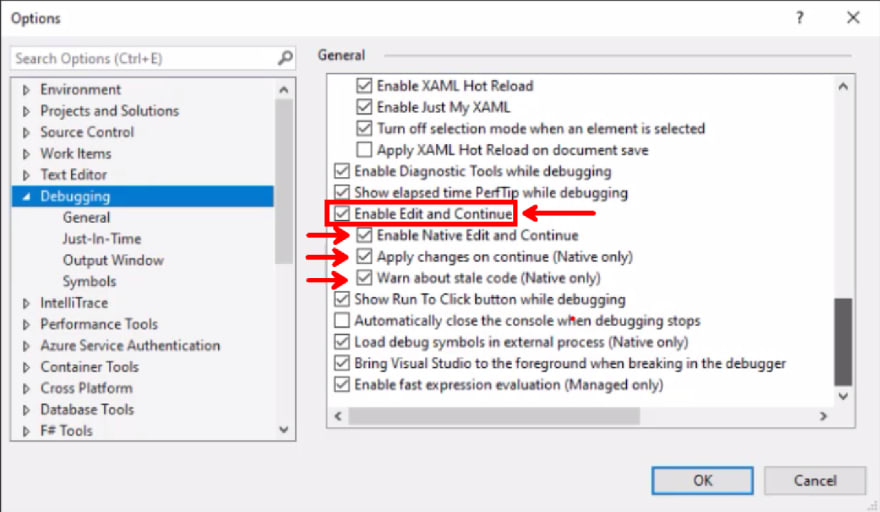
We have an option in the visual studio called edit on continue in debug section that allows us to change our code and run directly in our debug mode without stopping and starting our application again.
This content originally appeared on DEV Community 👩💻👨💻 and was authored by Hootan Hemmati
Hootan Hemmati | Sciencx (2023-02-12T20:14:58+00:00) Debugging in .NET apps using Visual Studio Part 2. Retrieved from https://www.scien.cx/2023/02/12/debugging-in-net-apps-using-visual-studio-part-2/
Please log in to upload a file.
There are no updates yet.
Click the Upload button above to add an update.


