Distributed Tracing in Microservices using Open Telemetry

OpenTelemetry and Observability: Implementing Effective Distributed Tracing in Microservices

Photo by Shubham’s Web3 on Unsplash

In the world of microservices, software architectures are becoming increasingly distributed and complex, making it challenging to observe the interactions between services. In a distributed system, services are often spread across multiple machines, networks, and data centers. This complexity makes it difficult to identify the source of errors or performance issues. Distributed tracing provides a solution to this problem by providing developers with insights into how their system is behaving to various traffic patterns and allowing them to identify and address issues quickly.

When it comes to distributed tracing, there are several providers to choose from. However, OpenTelemetry has emerged as the preferred choice due to its vendor-agnostic and open-source approach. OpenTelemetry is a powerful observability framework that can be used to instrument and collect telemetry data from various sources, providing developers with a unified way to collect and analyze telemetry data from different systems.

In this blog post, I will walk you through on

  1. How to instrument a microservices-based application in a Kubernetes cluster with OpenTelemetry.
  2. How to setup propagators to carry forward the trace context across service boundaries.
  3. How to setup Zipkin and use it to analyze traces that span multiple services, and understand how the services interact with each other.

Before we dive into the implementation details, let’s first cover some basic concepts of OpenTelemetry that you’ll need to understand to follow along.

  • Span: A span represents a single unit of work within a trace. Each span has a unique identifier, a start and end time, and a set of key-value pairs that represent metadata about the work being performed.
  • Trace Context: Trace context refers to the information that is passed between services in order to correlate spans into a single trace. Trace context includes the trace ID and span ID, as well as other metadata such as the parent span ID.
  • Propagators: Propagators are responsible for propagating trace context across different services and protocols. They ensure that trace context is carried over between services in order to correlate spans into a single trace. OpenTelemetry supports multiple propagators, including the W3C Trace Context and B3 propagators. The W3C Trace Context propagator uses standard HTTP headers to propagate trace context, while the B3 propagator uses custom headers.
  • Exporters: Exporters are responsible for taking the tracing data generated by your application and sending it to a backend system for storage and analysis. Exporters can send data to a variety of systems, including databases, logging systems, and distributed tracing systems like Jaeger or Zipkin.

Now that we’ve covered the basic concepts of OpenTelemetry, let’s move on to the implementation details. We’ll start by setting up a Kubernetes cluster, deploying some microservices, and then instrumenting those microservices using OpenTelemetry.

Cluster Setup

Pre- requisites :

  1. Let’s setup a simple k8s cluster to experiment with distributed tracing :
# clone the repo
git clone https://github.com/veerashayyagari/otel-distributed-tracing

# move to the directory
cd otel-distributed-tracing

# spin up a local k8s cluster (name : otel-tracing)
make kind-up

2. Let’s build and deploy microservices into this cluster:

# make kind-deploy command will :
# 1. build code for the microservices into a docker container
# 2. upload the docker containers to the kind cluster
# 3. spin up k8s deployments and services to run these containers in k8s pods
make kind-deploy

3. Let’s deploy zipkin into this cluster:

# make kind-deploy-zipkin command will :
# 1. create a new k8s namespace for zipkin pod and svc
# 2. pull the zipkin image from dockerhub and deploy into k8s cluster
make kind-deploy-zipkin

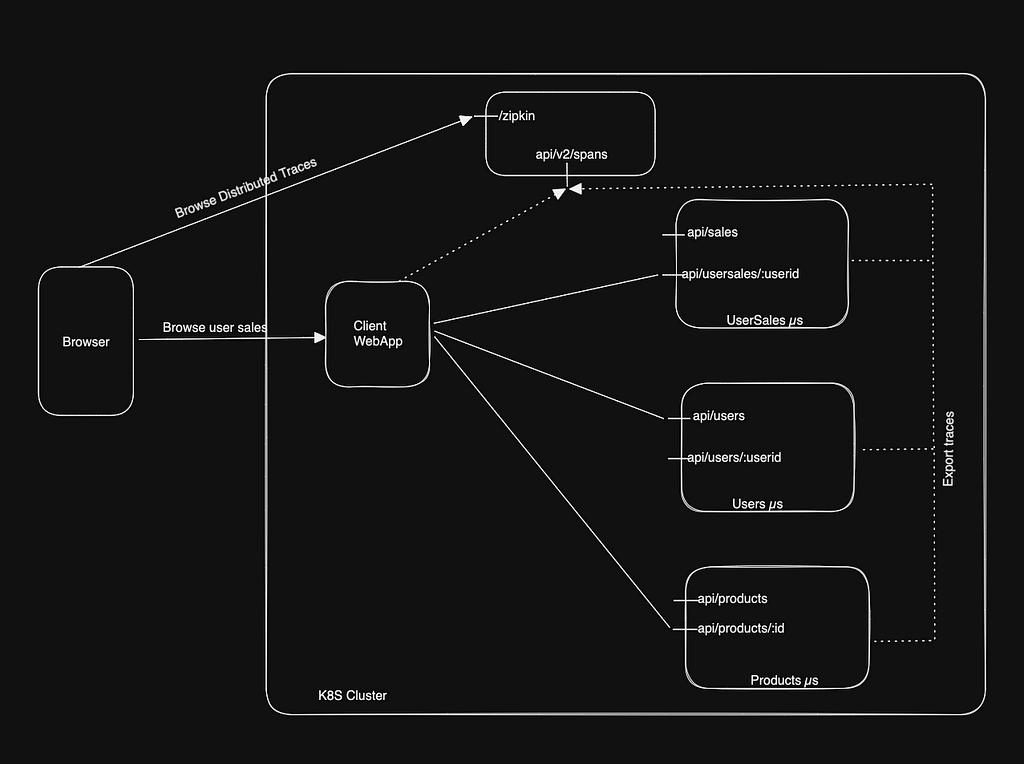
Here’s how the cluster setup will look like after completing the above steps.

K8S cluster with Microservices
  • Users Microservice : Exposes API endpoints that allow the clients to ask for all the users or a specific user by their id
  • Products Microservice : Exposes API endpoints that allow the clients to ask for all the products or a specific product details by it’s id
  • UserSales Microservice : Exposes API endpoints that allow the clients to ask for all the user sales or sales of a specific user by their id.
  • WebApp : Is the client that is exposed to end user. Then the end user will be able to browse to
    http://localhost:3000/users : to see the list of store users and their info. WebApp calls the api/users endpoint on the users microservice to display this list
    http://localhost:3000/usersales/:userid : to see the product details that are purchased by the store user with userid. WebApp first calls api/usersales/:userid on usersales microservice to get all the purchased product ids and then calls api/products/:productid on products microservice for product details of each product.
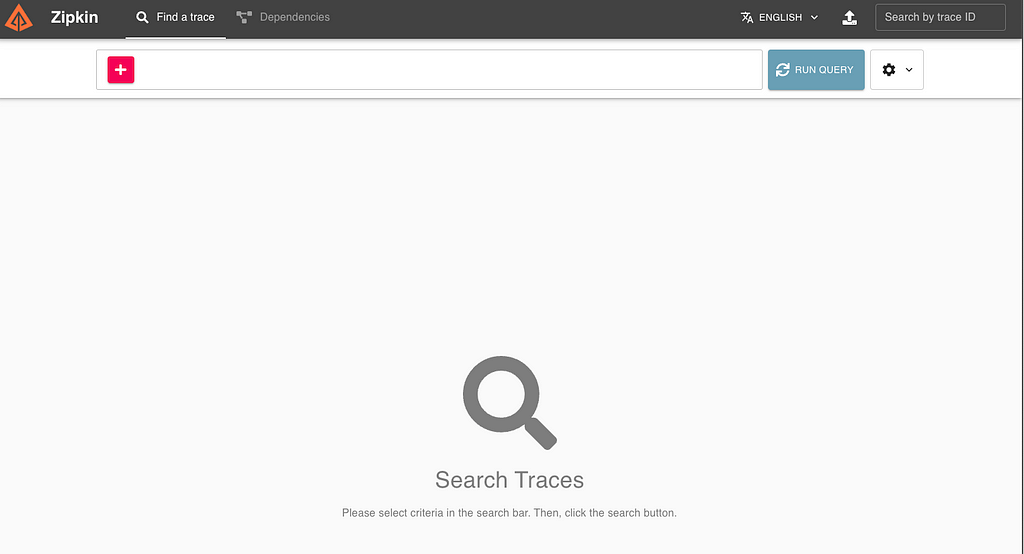
  • Zipkin : Is the distributed tracing system which exposes an api endpoint api/v2/spans to export trace data from each of the services and the webapp. Browsing to http://localhost:9411/zipkin will display the zipkin web application with zero traces.
Zipkin web view in k8s cluster

Instrument the code using Open Telemetry SDK

  • Let’s create a utility function that takes care of configuring Resource, Exporter, TracerProvider and Propagator and returns an instance of Tracer.
// ====================RESOURCE CONFIGURATION===================================

// create a new resource that adds the servicename, version and env info
r, err := resource.Merge(
resource.Default(),
resource.NewWithAttributes(
semconv.SchemaURL,
semconv.ServiceName(cfg.ServiceName),
semconv.ServiceVersion(cfg.ServiceVersion),
attribute.String("environment", cfg.Environment),
),
)


// ====================EXPORTER CONFIGURATION===================================

// newExporter configures zipkin exporter when a valid export URI is passed,
// else will configure a stdouttrace exporter that writes to traces.txt file
func newExporter(exportURI string) (trace.SpanExporter, error) {
// if the supplied export uri is invalid, write to stdouttrace
if _, err := url.Parse(exportURI); err != nil {
if f, e := os.Create("traces.txt"); e != nil {
return nil, fmt.Errorf("create traces.txt file: %w", e)
} else {
return stdouttrace.New(
// use traces.txt for writing out traces
stdouttrace.WithWriter(f),

// use human-readable output.
stdouttrace.WithPrettyPrint(),
)
}

}

// if we have a valid export URI , export logs to the service running zipkin
return zipkin.New(exportURI)
}


// ===============TRACER PROVIDER and PROPAGATOR CONFIGURATION=================

// configure new tracer provider with resource, exporter
exp, err := newExporter(cfg.ExportURI)
if err != nil {
return nil, fmt.Errorf("creating new exporter: %w", err)
}
tp := trace.NewTracerProvider(
// in prod, sample only small percent of traces
// trace.WithSampler(trace.TraceIDRatioBased(0.05)),
trace.WithSampler(trace.AlwaysSample()),
trace.WithBatcher(exp,
trace.WithMaxExportBatchSize(trace.DefaultMaxExportBatchSize),
trace.WithBatchTimeout(trace.DefaultScheduleDelay*time.Millisecond),
trace.WithMaxExportBatchSize(trace.DefaultMaxExportBatchSize),
),
trace.WithResource(r),
)

// configure the propagator and return the tracer instance to be used
propagator := propagation.NewCompositeTextMapPropagator(propagation.TraceContext{})
otel.SetTracerProvider(tp)
otel.SetTextMapPropagator(propagator)
return tp.Tracer(cfg.ServiceName), nil
  • During the bootstrapping of each service, let’s use the above utility function to obtain an instance of tracer
cfg := &tracer.TraceConfig{
ServiceName: name,
ServiceVersion: version,
Environment: build,
ExportURI: os.Getenv("ZIPKIN_API_URI"),
}

tr, err := tracer.NewTraceProvider(cfg)
if err != nil {
log.Println("failed to setup tracer.", err)
}
  • Let’s create a middleware function, that takes in a route handler and wraps it with the tracing logic
func Wrap(h httprouter.Handle, tr otrace.Tracer) httprouter.Handle {
return func(w http.ResponseWriter, r *http.Request, p httprouter.Params) {
// start a new trace with name like "get /users/2"
ctx, span := tr.Start(r.Context(), fmt.Sprintf("%s:%s", r.Method, r.URL.Path))
startTime := time.Now().UTC()

// measure the time it took for the code to run and add it as an attribute
defer span.SetAttributes(attribute.Int("execution.time", int(time.Now().UTC().Sub(startTime))))
defer span.End()

// run the passed in handler by passing in the new trace context
h(w, r.WithContext(ctx), p)
}
}
  • Wrap each route with the middleware and also add otelhttp.NewHandler wrapper to the uber router (or mux). This knows how to extract propagated context between service boundaries and set it in the new request context.
type Router struct {
http.Handler
trace.Tracer
}

func New(tr trace.Tracer) *Router {
r := &Router{
Tracer: tr,
}
router := httprouter.New()

// wrap with tracer middleware
router.GET("/api/sales/:id", tracer.Wrap(getSalesByID, tr))
router.GET("/api/usersales/:uid", tracer.Wrap(getSalesByUserID, tr))

// wrap the uber handler with otelhttp.NewHandler
r.Handler = otelhttp.NewHandler(router, "sales-api")
return r
}
func (ro *Router) getUserSales(ctx context.Context, uid string) ([]m.Sale, error) {

// instrumenting getUserSales method to observe the duration
_, span := ro.Tracer.Start(ctx, fmt.Sprintf("getUserSales:%s", uid))
startTime := time.Now().UTC()
defer span.SetAttributes(attribute.Int("execution.time", int(time.Now().UTC().Sub(startTime))))
defer span.End()

// code omitted for conciseness

}
  • Let’s build new docker images with these changes and deploy to the cluster to observe traces for the requests across various services
// build new images for all the services and webapp
make build-all

// load the new images into k8s cluster and get them up and running
make kind-update
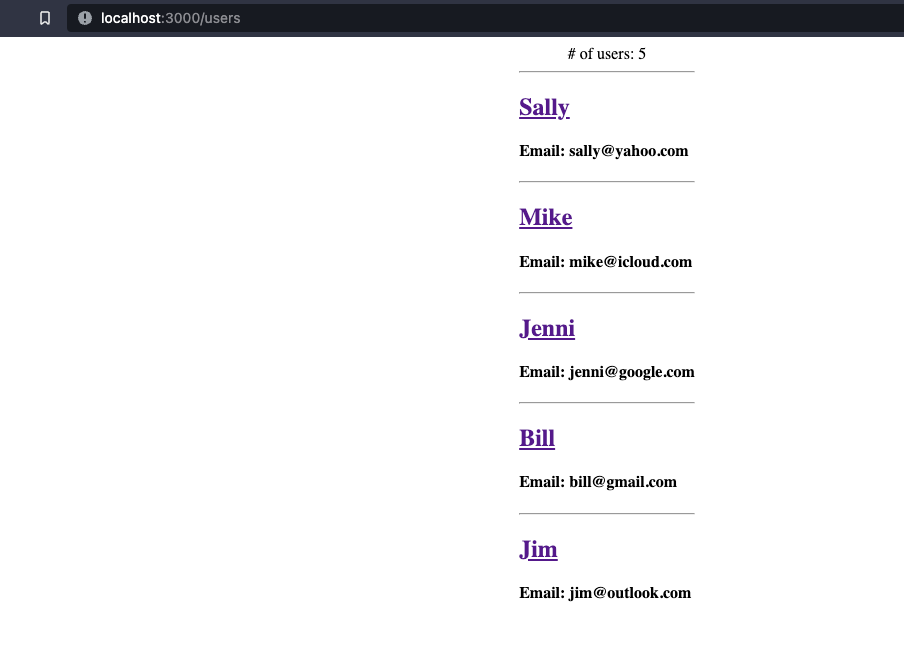
users page
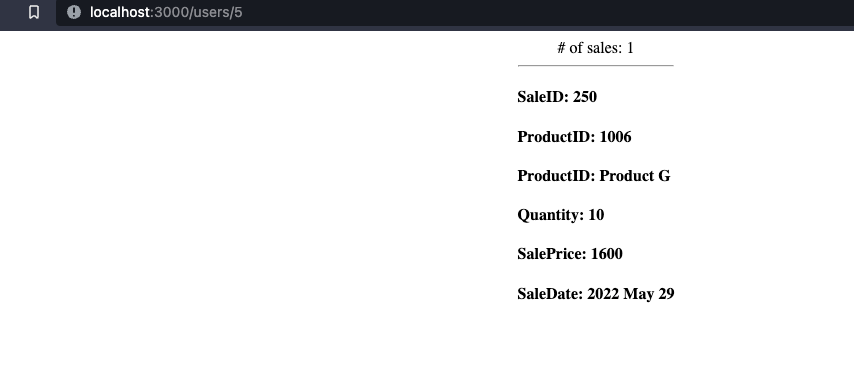
user sales page
  • Let’s now browse to Zipkin dashboard ( http://localhost:9411/zipkin ) to observe the traces from the client (webapp) all the way to the backend services (users and sales)
zipkin dashboard with traces
  • Click on the show button to observe the detailed traces including any additional tracing that we have added
users page traces showing up in zipkin
user sales page traces showing up in zipkin

If you have made this far, you have successfully instrumented a microservices-based system running on Kubernetes using OpenTelemetry! By leveraging OpenTelemetry’s tracing capabilities , we were able to gain insights into the flow of requests and responses across our system and using a system like Zipkin we could monitor performance and identify bottlenecks.

With these tools, you can now confidently navigate the complex world of distributed systems, diagnose issues, and optimize performance. Keep experimenting and exploring the possibilities of distributed tracing with OpenTelemetry. And, if you found this post helpful, be sure to give it a clap and follow me for more informative content like this. Happy hacking!

Level Up Coding

Thanks for being a part of our community! Before you go:

🚀👉 Join the Level Up talent collective and find an amazing job


Distributed Tracing in Microservices using Open Telemetry was originally published in Level Up Coding on Medium, where people are continuing the conversation by highlighting and responding to this story.


This content originally appeared on Level Up Coding - Medium and was authored by Veerash Ayyagari

OpenTelemetry and Observability: Implementing Effective Distributed Tracing in Microservices

Photo by Shubham's Web3 on Unsplash

In the world of microservices, software architectures are becoming increasingly distributed and complex, making it challenging to observe the interactions between services. In a distributed system, services are often spread across multiple machines, networks, and data centers. This complexity makes it difficult to identify the source of errors or performance issues. Distributed tracing provides a solution to this problem by providing developers with insights into how their system is behaving to various traffic patterns and allowing them to identify and address issues quickly.

When it comes to distributed tracing, there are several providers to choose from. However, OpenTelemetry has emerged as the preferred choice due to its vendor-agnostic and open-source approach. OpenTelemetry is a powerful observability framework that can be used to instrument and collect telemetry data from various sources, providing developers with a unified way to collect and analyze telemetry data from different systems.

In this blog post, I will walk you through on

  1. How to instrument a microservices-based application in a Kubernetes cluster with OpenTelemetry.
  2. How to setup propagators to carry forward the trace context across service boundaries.
  3. How to setup Zipkin and use it to analyze traces that span multiple services, and understand how the services interact with each other.

Before we dive into the implementation details, let’s first cover some basic concepts of OpenTelemetry that you’ll need to understand to follow along.

  • Span: A span represents a single unit of work within a trace. Each span has a unique identifier, a start and end time, and a set of key-value pairs that represent metadata about the work being performed.
  • Trace Context: Trace context refers to the information that is passed between services in order to correlate spans into a single trace. Trace context includes the trace ID and span ID, as well as other metadata such as the parent span ID.
  • Propagators: Propagators are responsible for propagating trace context across different services and protocols. They ensure that trace context is carried over between services in order to correlate spans into a single trace. OpenTelemetry supports multiple propagators, including the W3C Trace Context and B3 propagators. The W3C Trace Context propagator uses standard HTTP headers to propagate trace context, while the B3 propagator uses custom headers.
  • Exporters: Exporters are responsible for taking the tracing data generated by your application and sending it to a backend system for storage and analysis. Exporters can send data to a variety of systems, including databases, logging systems, and distributed tracing systems like Jaeger or Zipkin.

Now that we’ve covered the basic concepts of OpenTelemetry, let’s move on to the implementation details. We’ll start by setting up a Kubernetes cluster, deploying some microservices, and then instrumenting those microservices using OpenTelemetry.

Cluster Setup

Pre- requisites :

  1. Let’s setup a simple k8s cluster to experiment with distributed tracing :
# clone the repo
git clone https://github.com/veerashayyagari/otel-distributed-tracing

# move to the directory
cd otel-distributed-tracing

# spin up a local k8s cluster (name : otel-tracing)
make kind-up

2. Let’s build and deploy microservices into this cluster:

# make kind-deploy command will :
# 1. build code for the microservices into a docker container
# 2. upload the docker containers to the kind cluster
# 3. spin up k8s deployments and services to run these containers in k8s pods
make kind-deploy

3. Let’s deploy zipkin into this cluster:

# make kind-deploy-zipkin command will :
# 1. create a new k8s namespace for zipkin pod and svc
# 2. pull the zipkin image from dockerhub and deploy into k8s cluster
make kind-deploy-zipkin

Here’s how the cluster setup will look like after completing the above steps.
K8S cluster with Microservices
  • Users Microservice : Exposes API endpoints that allow the clients to ask for all the users or a specific user by their id
  • Products Microservice : Exposes API endpoints that allow the clients to ask for all the products or a specific product details by it’s id
  • UserSales Microservice : Exposes API endpoints that allow the clients to ask for all the user sales or sales of a specific user by their id.
  • WebApp : Is the client that is exposed to end user. Then the end user will be able to browse to
    - http://localhost:3000/users : to see the list of store users and their info. WebApp calls the api/users endpoint on the users microservice to display this list
    - http://localhost:3000/usersales/:userid : to see the product details that are purchased by the store user with userid. WebApp first calls api/usersales/:userid on usersales microservice to get all the purchased product ids and then calls api/products/:productid on products microservice for product details of each product.
  • Zipkin : Is the distributed tracing system which exposes an api endpoint api/v2/spans to export trace data from each of the services and the webapp. Browsing to http://localhost:9411/zipkin will display the zipkin web application with zero traces.
Zipkin web view in k8s cluster

Instrument the code using Open Telemetry SDK

  • Let’s create a utility function that takes care of configuring Resource, Exporter, TracerProvider and Propagator and returns an instance of Tracer.
// ====================RESOURCE CONFIGURATION===================================

// create a new resource that adds the servicename, version and env info
r, err := resource.Merge(
resource.Default(),
resource.NewWithAttributes(
semconv.SchemaURL,
semconv.ServiceName(cfg.ServiceName),
semconv.ServiceVersion(cfg.ServiceVersion),
attribute.String("environment", cfg.Environment),
),
)


// ====================EXPORTER CONFIGURATION===================================

// newExporter configures zipkin exporter when a valid export URI is passed,
// else will configure a stdouttrace exporter that writes to traces.txt file
func newExporter(exportURI string) (trace.SpanExporter, error) {
// if the supplied export uri is invalid, write to stdouttrace
if _, err := url.Parse(exportURI); err != nil {
if f, e := os.Create("traces.txt"); e != nil {
return nil, fmt.Errorf("create traces.txt file: %w", e)
} else {
return stdouttrace.New(
// use traces.txt for writing out traces
stdouttrace.WithWriter(f),

// use human-readable output.
stdouttrace.WithPrettyPrint(),
)
}

}

// if we have a valid export URI , export logs to the service running zipkin
return zipkin.New(exportURI)
}


// ===============TRACER PROVIDER and PROPAGATOR CONFIGURATION=================

// configure new tracer provider with resource, exporter
exp, err := newExporter(cfg.ExportURI)
if err != nil {
return nil, fmt.Errorf("creating new exporter: %w", err)
}
tp := trace.NewTracerProvider(
// in prod, sample only small percent of traces
// trace.WithSampler(trace.TraceIDRatioBased(0.05)),
trace.WithSampler(trace.AlwaysSample()),
trace.WithBatcher(exp,
trace.WithMaxExportBatchSize(trace.DefaultMaxExportBatchSize),
trace.WithBatchTimeout(trace.DefaultScheduleDelay*time.Millisecond),
trace.WithMaxExportBatchSize(trace.DefaultMaxExportBatchSize),
),
trace.WithResource(r),
)

// configure the propagator and return the tracer instance to be used
propagator := propagation.NewCompositeTextMapPropagator(propagation.TraceContext{})
otel.SetTracerProvider(tp)
otel.SetTextMapPropagator(propagator)
return tp.Tracer(cfg.ServiceName), nil
  • During the bootstrapping of each service, let’s use the above utility function to obtain an instance of tracer
cfg := &tracer.TraceConfig{
ServiceName: name,
ServiceVersion: version,
Environment: build,
ExportURI: os.Getenv("ZIPKIN_API_URI"),
}

tr, err := tracer.NewTraceProvider(cfg)
if err != nil {
log.Println("failed to setup tracer.", err)
}
  • Let’s create a middleware function, that takes in a route handler and wraps it with the tracing logic
func Wrap(h httprouter.Handle, tr otrace.Tracer) httprouter.Handle {
return func(w http.ResponseWriter, r *http.Request, p httprouter.Params) {
// start a new trace with name like "get /users/2"
ctx, span := tr.Start(r.Context(), fmt.Sprintf("%s:%s", r.Method, r.URL.Path))
startTime := time.Now().UTC()

// measure the time it took for the code to run and add it as an attribute
defer span.SetAttributes(attribute.Int("execution.time", int(time.Now().UTC().Sub(startTime))))
defer span.End()

// run the passed in handler by passing in the new trace context
h(w, r.WithContext(ctx), p)
}
}
  • Wrap each route with the middleware and also add otelhttp.NewHandler wrapper to the uber router (or mux). This knows how to extract propagated context between service boundaries and set it in the new request context.
type Router struct {
http.Handler
trace.Tracer
}

func New(tr trace.Tracer) *Router {
r := &Router{
Tracer: tr,
}
router := httprouter.New()

// wrap with tracer middleware
router.GET("/api/sales/:id", tracer.Wrap(getSalesByID, tr))
router.GET("/api/usersales/:uid", tracer.Wrap(getSalesByUserID, tr))

// wrap the uber handler with otelhttp.NewHandler
r.Handler = otelhttp.NewHandler(router, "sales-api")
return r
}
func (ro *Router) getUserSales(ctx context.Context, uid string) ([]m.Sale, error) {

// instrumenting getUserSales method to observe the duration
_, span := ro.Tracer.Start(ctx, fmt.Sprintf("getUserSales:%s", uid))
startTime := time.Now().UTC()
defer span.SetAttributes(attribute.Int("execution.time", int(time.Now().UTC().Sub(startTime))))
defer span.End()

// code omitted for conciseness

}
  • Let’s build new docker images with these changes and deploy to the cluster to observe traces for the requests across various services
// build new images for all the services and webapp
make build-all

// load the new images into k8s cluster and get them up and running
make kind-update
users page
user sales page
  • Let’s now browse to Zipkin dashboard ( http://localhost:9411/zipkin ) to observe the traces from the client (webapp) all the way to the backend services (users and sales)
zipkin dashboard with traces
  • Click on the show button to observe the detailed traces including any additional tracing that we have added
users page traces showing up in zipkin
user sales page traces showing up in zipkin

If you have made this far, you have successfully instrumented a microservices-based system running on Kubernetes using OpenTelemetry! By leveraging OpenTelemetry’s tracing capabilities , we were able to gain insights into the flow of requests and responses across our system and using a system like Zipkin we could monitor performance and identify bottlenecks.

With these tools, you can now confidently navigate the complex world of distributed systems, diagnose issues, and optimize performance. Keep experimenting and exploring the possibilities of distributed tracing with OpenTelemetry. And, if you found this post helpful, be sure to give it a clap and follow me for more informative content like this. Happy hacking!

Level Up Coding

Thanks for being a part of our community! Before you go:

🚀👉 Join the Level Up talent collective and find an amazing job


Distributed Tracing in Microservices using Open Telemetry was originally published in Level Up Coding on Medium, where people are continuing the conversation by highlighting and responding to this story.


This content originally appeared on Level Up Coding - Medium and was authored by Veerash Ayyagari


Print Share Comment Cite Upload Translate Updates
APA

Veerash Ayyagari | Sciencx (2023-04-07T17:37:52+00:00) Distributed Tracing in Microservices using Open Telemetry. Retrieved from https://www.scien.cx/2023/04/07/distributed-tracing-in-microservices-using-open-telemetry/

MLA
" » Distributed Tracing in Microservices using Open Telemetry." Veerash Ayyagari | Sciencx - Friday April 7, 2023, https://www.scien.cx/2023/04/07/distributed-tracing-in-microservices-using-open-telemetry/
HARVARD
Veerash Ayyagari | Sciencx Friday April 7, 2023 » Distributed Tracing in Microservices using Open Telemetry., viewed ,<https://www.scien.cx/2023/04/07/distributed-tracing-in-microservices-using-open-telemetry/>
VANCOUVER
Veerash Ayyagari | Sciencx - » Distributed Tracing in Microservices using Open Telemetry. [Internet]. [Accessed ]. Available from: https://www.scien.cx/2023/04/07/distributed-tracing-in-microservices-using-open-telemetry/
CHICAGO
" » Distributed Tracing in Microservices using Open Telemetry." Veerash Ayyagari | Sciencx - Accessed . https://www.scien.cx/2023/04/07/distributed-tracing-in-microservices-using-open-telemetry/
IEEE
" » Distributed Tracing in Microservices using Open Telemetry." Veerash Ayyagari | Sciencx [Online]. Available: https://www.scien.cx/2023/04/07/distributed-tracing-in-microservices-using-open-telemetry/. [Accessed: ]
rf:citation
» Distributed Tracing in Microservices using Open Telemetry | Veerash Ayyagari | Sciencx | https://www.scien.cx/2023/04/07/distributed-tracing-in-microservices-using-open-telemetry/ |

Please log in to upload a file.


There are no updates yet.
Click the Upload button above to add an update.

You must be logged in to translate posts. Please log in or register.