This content originally appeared on Level Up Coding - Medium and was authored by Summer He
A Comprehensive Guide to Generating Star Maps with Python Based on Any Location and Time of Day

Are you fascinated by the night sky and the beauty of the constellations? Whether it's the majesty of the Milky Way or the wonder of a shooting star, there's something undeniably magical about looking up at the stars.
As a data enthusiast fascinated by the deep sky, have you ever wondered how to generate a star map using Python and your data analysis skills? In this blog, we will explore the art of creating beautiful sky maps by applying data science techniques. We will dig into the fundamentals of the night sky and how to use Python to visualize the star map with stunning accuracy. So, join me on this journey as we unlock the universe's secrets through code!
A brief introduction to the night sky
Looking up at the night sky, we will see an inspiring combination of stars, planets, and constellations. Each object has its unique beauty, and studying them can reveal much about the universe and our place in it. Before we dive into any programming, let's first introduce two common concepts in astronomy.
Astronomers categorize these objects by their Constellations, which are groups of stars that form recognizable patterns or shapes in the sky. Observing and grouping stars into constellations dates back thousands of years to ancient Babylonian and Egyptian civilizations. Today, there are 88 officially recognized constellations, each with its unique mythology, history, and characteristics.
The apparent magnitude of a night sky object is a measure of its brightness as seen from Earth. The scale of the magnitude is logarithmic reversely, which means that the brighter a star is, the lower the magnitude level. The brightest stars in the night sky can have a negative magnitude of around -1 or -4, for example, Venus at −4.2 or Sirius at −1.46. The faintest star that the naked eye can see is about 6.5, while with 50-millimeter binoculars, the visible objects would be at a magnitude of about 9. For some amateur telescopes, you could even view a magnitude of objects around 13.
A quick overview of Python and the libraries needed.
I have always believed that the origin of constellations can be attributed to human imagination, just like the concept of the Dual Vector Foil described in The Three-Body Problem novel. Ancient people used their creativity to undergo a dimensional reduction of our observable universe from 3D to 2D, forming romantic constellation stories. Therefore, when we discuss creating a star map using Python, we are producing a 2D scatter plot that is projected and centered on Earth.
We need to install Python and the required libraries to begin generating star maps with Python. The essential Python libraries for star maps are Skyfield and Matplotlib. Skyfield is a Python library for astronomy that provides a comprehensive set of tools for working with time and space. Skyfield also includes Stellarium Data, a popular desktop planetarium software that can generate star maps and views of the night sky. With these tools and data, we can create detailed and accurate star maps from any location and time of day.
Once we've installed Python and the required libraries, we can start our star map journey.
How to download and parse the star catalogs
To create our star chart, we need to load three datasets from Skyfield and Stellarium:
- De421.bsp: contains the positions of the major planets, the Moon and the Sun. This file is commonly used to compute the relative position/distance of the start to the Earth.
- Hipparcos: contains over 100,000 stars' positions, magnitudes, and spectral types. It is one of astronomy's most widely used star catalogs to determine star positions and magnitudes.
- Constellations: contains the boundaries of the 88 constellations recognized by the International Astronomical Union. This will be used to draw the constellation lines on our star map.
We can useload()function to download the dataset locally separately. Here is the summarized function to load these three datasets into memory:
How to calculate the position of stars for a given location and time
Now that we have loaded all the datasets we need, let's define a function to generate celestial data projection. This function will take a location and a date/time as input and then return the relative positions of stars and edges of constellations as seen from that location and at that time to be centered in the view. Let's take a closer look at the details.
- Firstly, I will use some of Viyaleta Apgar's code to convert a given location to a longitude and altitude position using Nominatim. This geocoding service provides latitude and longitude coordinates for a given area. Then, we will apply wgs84() to define an observer using the world geodetic system data on a given daytime.
- The next step is to set the position where the observer will be looking and centers the observations in the middle of the sky using earth.at() function.
- Afterward, we built a stereographic projection to calculate the positions of the stars relative to Earth at a specific time and project them onto a 2D plane using build_stereographic_projection() and projection().
- Lastly, we will extract the edges of constellations visible from the given location using data from Stellarium. We make a list comprehension that contains the start stars and the end starts of edges.
At the end of this session, we should have the datasets that can reflect the relative positive from the Earth to the night sky objects defined by a given location and time. Here is the summarized syntax to get the projection star data:
How to create a customized star map with Matplotlib
Now we have everything we need for the scatter plot, we can start making the star map.
- First, we define the faintest start to show in the plot, as we want to include only some of the 100,000 stars. Based on the star magnitude, we know that only those with a magnitude of ≤ 6 are visible to the naked eye. Let's limit the magnitude of stars on our star map to less than 10 to assume you have a binocular for your stargazing.
- Next, we specify the constellation lines by looping the start star to the end star within each constellation to add the edges.
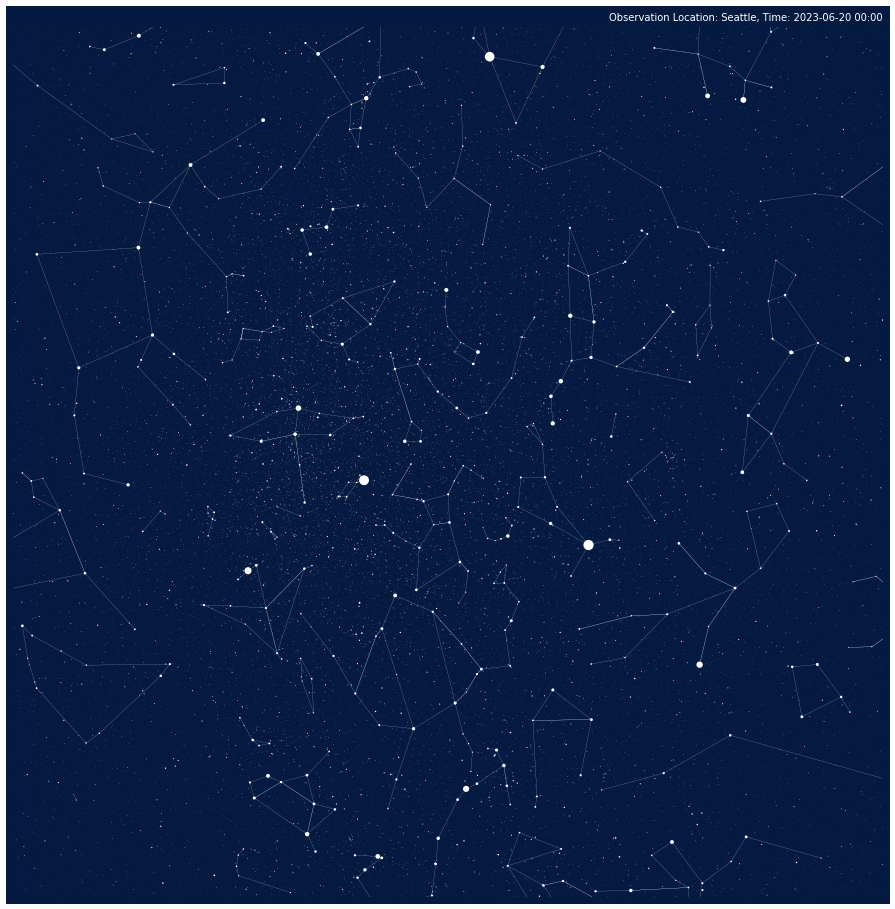
- Lastly, we start to build our plot on a night sky background using the Subplot()function in Matplotlib. We add stars and constellations to the image as scatter charts and line charts. Using the plt.show() function, we display the star map with a title based on the given location and time.
And voila! Our Python-generated sky map is ready to marvel at. Meantime, you can always increase the max_start_size to include more stars on your star map.

Let's iterate more on the plot! We can modify the view of the night sky to a circular shape by adding a circle patch to the plot. This can be achieved in Matplotlib using the Circle() function. Once we have defined the circle, we can use the set_clip_path() method to clip any elements in the plot outside of the circle. This ensures that all the parts outside the circle are not visible in the final plot. Here is an example of the circular plot from Viyaleta Apgar's blog.
At the end of this session, we should be able to generate an accurate star map as above; the function can be helpful for anyone interested in observing the night sky. By adjusting the location and time parameters, sky watchers can explore the night sky from different perspectives and learn about the stars and constellations visible at different times and places.
How to use the star map to plan stargazing journeys
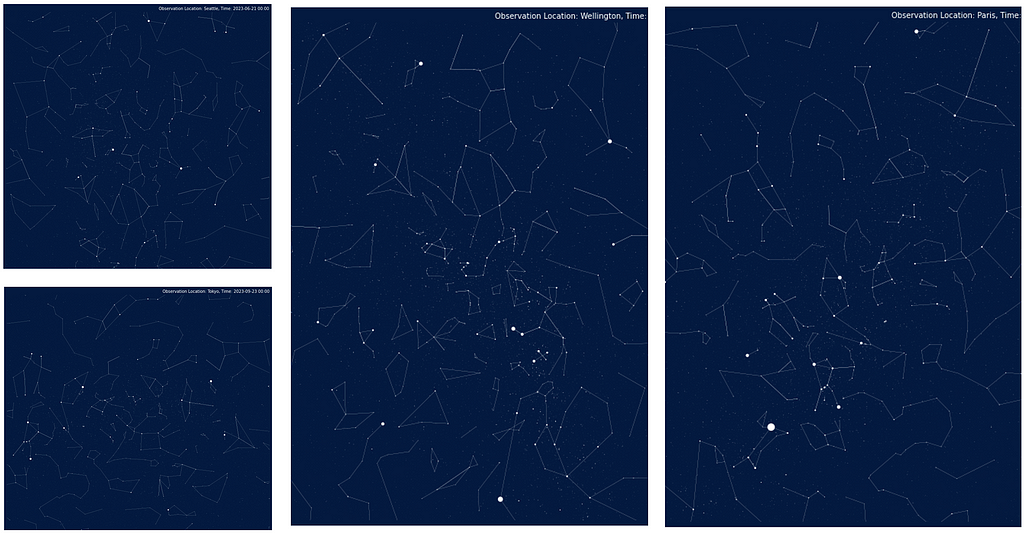
Now, let's take this generated star map to the next level. Imagine that I'm a sky watcher enthusiast, and I want to create star maps for the Vernal Equinox (Mar 20th), Summer Solstice (Jun 21st), Autumnal Equinox (Sep 23rd), and Winter Solstice (Dec 22th) on multiple visiting locations to help me plan out my annual stargazing adventures. In this case, I want to write a loop function to generate a bulk sky map based on my desired places and trip times. Also, remember to check out the moon phase calendar ahead of your trip.
Take a glance at the star maps:

You can also save the plot with a high-resolution version by increasing the dpi. I wrapped all the syntax in the entire notebook on GitHub and included some high-resolution plot examples here.
Conclusion
Exploring the night sky with Python is a fun way to learn about the stars and constellations. With the help of Skyfield and Stellarium libraries, we can collect celestial data and plot it as a chart better to understand the positions of stars and edges of constellations. By adding location and time information to our chart, we can keep track of different observations and compare them over time. So why not look up at the night sky tonight and start to plan your next stargazing journey? Happy stargazing and happy coding!
Reference
[1] Skyfielders
[2] I Made a Sky Map in Python. Here's How.
Level Up Coding
Thanks for being a part of our community! Before you go:
- 👏 Clap for the story and follow the author 👉
- 📰 View more content in the Level Up Coding publication
- 💰 Free coding interview course ⇒ View Course
- 🔔 Follow us: Twitter | LinkedIn | Newsletter
🚀👉 Join the Level Up talent collective and find an amazing job
How to Use Python to Create Custom Star Maps for Your Next Stargazing Journey was originally published in Level Up Coding on Medium, where people are continuing the conversation by highlighting and responding to this story.
This content originally appeared on Level Up Coding - Medium and was authored by Summer He
Summer He | Sciencx (2023-04-20T16:31:32+00:00) How to Use Python to Create Custom Star Maps for Your Next Stargazing Journey. Retrieved from https://www.scien.cx/2023/04/20/how-to-use-python-to-create-custom-star-maps-for-your-next-stargazing-journey/
Please log in to upload a file.
There are no updates yet.
Click the Upload button above to add an update.
