
This content originally appeared on Level Up Coding - Medium and was authored by Nikhil Adithyan
A programmatic approach to combine the power of sentiment analysis and algorithmic trading

Introduction
A lot of algo traders experience great losses from their trading strategies though showing promising results in the backtesting processes. This is because the stocks’ movements are not driven by any technical indicators but are influenced by the mixed emotions and intuitions of traders in the real-world market.
Here’s where sentiment analysis plays a vital role. Measuring and analyzing the sentiment of stocks helps in obtaining an understanding of how the traders and the media perceive the stocks’ performance and their price movements. These factors are so crucial and harnessing such information can provide an edge in the market.
In previous years, obtaining the sentiment data of stocks was no easy task, but, nowadays, numerous resources like APIs have greatly facilitated the process of extraction and analysis of sentiment data.
In this article, we’ll be using one such API, which is the EOD Historical Data (EODHD) API, to acquire the sentiment data of stocks but instead of using this data for analysis purposes, we’ll be constructing a trading strategy out of it and backtest the strategy to see its performance in the practical world.
Python Implementation
Let’s start with importing the required packages into our Python environment. We’ll be using four packages in this article which are pandas for working with dataframes, requests for API calls, math for performing advanced numerical functions, and termcolor for beautifying the text output of the program. Import all the necessary packages using the following code:
import pandas as pd
import requests
import math
from termcolor import colored as cl
Before importing, make sure to install the packages using the command line. Now that we have all the required packages imported into our Python environment, we can proceed to the next step which is making API calls.
In order to extract the sentiment data of stocks, we’ll be using the EODHD Sentiment Data API, and EODHD End-of-Day API for the historical data of stocks. In this article, we’ll be using the sentiment and historical stock data of Microsoft to conduct the backtesting processes. The data can be easily extracted with the help of APIs using the following code:
api_key = '6156f2d1c12e19.46412053'
msft_sentiment = requests.get(f'https://eodhistoricaldata.com/api/tweets-sentiments?s=MSFT.US&from=2022-01-01&to=2023-04-19&api_token={api_key}').json()
msft_hist = requests.get(f'https://eodhistoricaldata.com/api/eod/MSFT.US?from=2022-01-01&to=2023-04-19&period=d&fmt=json&api_token={api_key}').json()
For the smooth functioning of the above code, change the YOUR API KEY to your EODHD account secret API token. If you don’t have an EODHD API key, firstly, head over to their website, then, finish the registration process to create an EODHD account, and finally, navigate to the ‘Settings’ page where you could find your secret EODHD API key. It is important to ensure that this secret API key is not revealed to anyone. Here’s a glimpse of the response of each API endpoint (left: sentiment API, right: historical API):
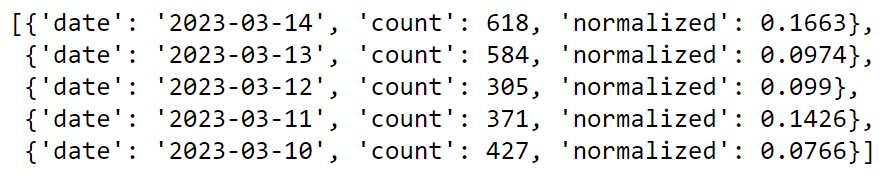
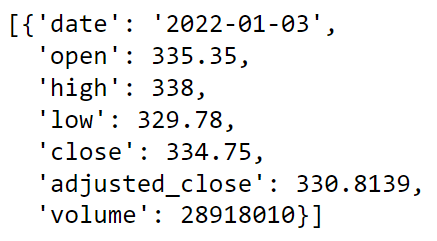
The response of the Historical Data API endpoint is self-explanatory and includes all the usual values. On the other hand, the Sentiment Data API endpoint’s response has some interesting information. There are three columns: date, count and normalized . The columns here in focus are the count and normalized column. The count column shows the number of news accumulated from various web sources with respect to the stock on a particular date and the normalized column represents the computed sentiment scores which turn positive and negative according to the stock’s current sentiment.
In order for us to work with the extracted data smoothly, it is necessary to convert the API responses from JSON format into Pandas dataframes. It can be done easily using the following code:
sentiment_df = pd.DataFrame(msft_sentiment['MSFT.US'])[::-1]
hist_df = pd.DataFrame(msft_hist)

msft = sentiment_df.merge(hist_df)
msft = msft.set_index('date')
msft.index = pd.to_datetime(msft.index)
msft.tail()
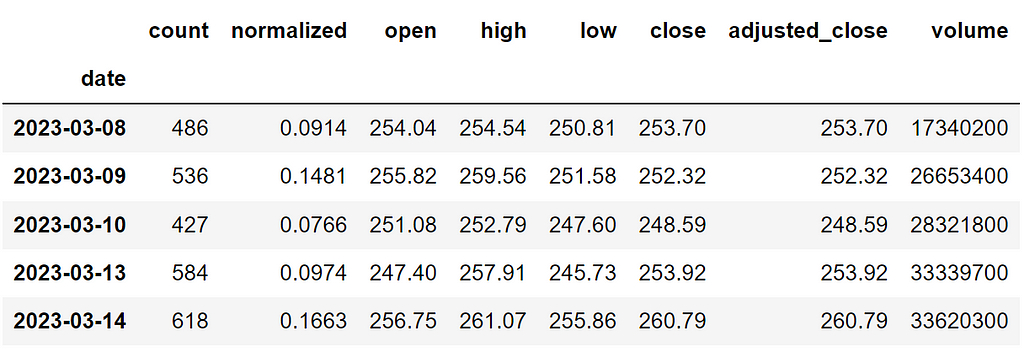
Here, we are first converting the API responses into individual Pandas dataframes. Then, we are using the merge function to combine the two dataframes for the purpose of matching the dates of the dataframes which before merging, differ from one another. This is the final dataframe:
Now it’s time for us to construct a trading strategy and backtest the same on the extracted data that is shown above. The trading strategy is going to be very simple. We will buy the stock when the sentiment score is greater than zero and we will sell the stock when the sentiment score is negative or lesser than zero. The logic behind this trading strategy is to enter the market when the stock is perceived to be bullish by the media and traders and exit when the situation is contrary. The following code will implement the trading strategy and reveal the results of the trades:
in_position = False
investment = 100000
equity = investment

for i in range(len(msft)):
    if msft['normalized'][i] > 0 and in_position == False:
        no_of_shares = math.floor(equity/msft.close[i])
        equity -= no_of_shares * msft.close[i]
        in_position = True
        print(cl('BUY: ', color = 'green', attrs = ['bold']), f'{no_of_shares} Shares are bought at ${msft.close[i]} on {msft.index[i]}')
    elif msft['normalized'][i] < 0 and in_position == True:
        equity += no_of_shares * msft.close[i]
        in_position = False
        print(cl('SELL: ', color = 'red', attrs = ['bold']), f'{no_of_shares} Shares are bought at ${msft.close[i]} on {msft.index[i]}')
if in_position == True:
    equity += no_of_shares * msft.close[i]
    print(cl(f'\nClosing position at {msft.close[i]} on {msft.index[i]}', attrs = ['bold']))
    in_position = False

earning = round(equity - investment, 2)
roi = round(earning / investment * 100, 2)
print(cl(f'EARNING: ${earning} ; ROI: {roi}%', attrs = ['bold']))
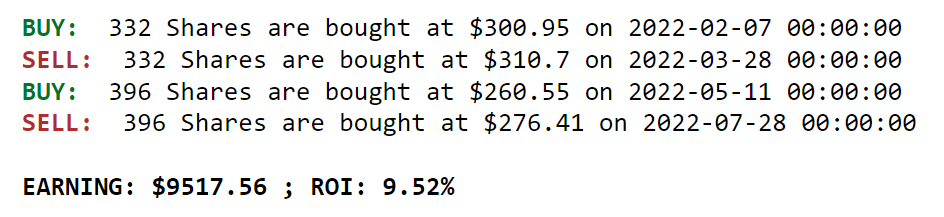
This code is heavily inspired by the backtesting code written by Yong Hong Tan in his article about the SuperTrend indicator. A shoutout to him for this amazing code. The backtesting results are pretty interesting and these are the trades executed by the program:

There are plenty of trades executed by the program during the course of the backtesting timeframe. But, the final earnings and the ROI is negative which means we have incurred a loss from our trading strategy. This indicates that it is time for us to re-engineer the strategy.
The main reason for incurring losses from the trading strategy is the number of false trades generated by it. One of the effective methods of containing false signals is to introduce another technical attribute like a technical indicator to the trading strategy. Here, we will go with one of the most well-known technical indicators, the Relative Strength Index. We are going with a momentum indicator because the other types of indicators tend to be lagging in nature which in our case, might affect the end results.
Now that we have decided to add a technical indicator, it’s also time to work on our existing trading strategy. The previous strategy is extremely simple which is perfectly fine, but since we have another technical indicator at our disposal, we can make the strategy a little more complex.
Here’s the final strategy: we will buy the stock when the sentiment score is negative and the RSI is lesser than 40, and we will sell the stock when the sentiment score is positive and the RSI is greater than 60. The logic here is to enter the market when the stock is available at an extremely low price and exit the market when it is overpriced. Here’s the backtesting code for implementing our new trading strategy:
msft_rsi = requests.get(f'https://eodhistoricaldata.com/api/technical/MSFT.US?fmt=json&from=2022-01-01&to=2023-04-19&function=rsi&period=14&api_token={api_key}').json()
rsi_df = pd.DataFrame(msft_rsi)
rsi_df['date'] = pd.to_datetime(rsi_df.date)

msft = msft.reset_index()
msft = msft.merge(rsi_df)
msft = msft.set_index('date')

in_position = False
investment = 100000
equity = investment

for i in range(len(msft)):
    if msft['normalized'][i] < 0 and msft['rsi'][i] < 40 and in_position == False:
        no_of_shares = math.floor(equity/msft.close[i])
        equity -= no_of_shares * msft.close[i]
        in_position = True
        print(cl('BUY: ', color = 'green', attrs = ['bold']), f'{no_of_shares} Shares are bought at ${msft.close[i]} on {msft.index[i]}')
    elif msft['normalized'][i] > 0 and msft['rsi'][i] > 60 and in_position == True:
        equity += no_of_shares * msft.close[i]
        in_position = False
        print(cl('SELL: ', color = 'red', attrs = ['bold']), f'{no_of_shares} Shares are bought at ${msft.close[i]} on {msft.index[i]}')
if in_position == True:
    equity += no_of_shares * msft.close[i]
    print(cl(f'\nClosing position at {msft.close[i]} on {msft.index[i]}', attrs = ['bold']))
    in_position = False

earning = round(equity - investment, 2)
roi = round(earning / investment * 100, 2)
print(cl(f'\nEARNING: ${earning} ; ROI: {roi}%', attrs = ['bold']))
In the beginning, we are extracting the RSI of Microsoft’s stock with a lookback period of 14 days which is later combined with the actual dataframe which consists of the sentiment scores and the historical data. After that, the backtesting code is pretty much the same as what we used earlier except for some changes to modify the trading strategy. Here are the generated trades and the backtesting results of the new strategy:
By observing the results, it is evident that we have reduced the number of false trades substantially and managed to get a profit out of the trading strategy. So it is safe to conclude that our strategy might have a good chance of performing well in the market.
Closing Notes
We did manage to construct a profitable trading strategy but it’s the end? Absolutely not. There is a lot of scope for development in several aspects of the program. Other technical indicators can be experimented with to see the possible outcomes. Backtesting the strategy on numerous stocks from different sectors can help in ascertaining the best stocks to implement the trading strategy on.
Like these, there are various other improvements that can be listed. So, this article is just a glance at the potential and the capability of combining the two forces of sentiment analysis and algo trading and there is still a vast area to delve into.
With that being said, you’ve reached the end of the article. A shoutout to EOD Historical Data for providing such interesting and incredibly useful data. If you have any queries or suggestions for improvement, let me know in the comments.
Level Up Coding
Thanks for being a part of our community! Before you go:
- 👏 Clap for the story and follow the author 👉
- 📰 View more content in the Level Up Coding publication
- 💰 Free coding interview course ⇒ View Course
- 🔔 Follow us: Twitter | LinkedIn | Newsletter
🚀👉 Join the Level Up talent collective and find an amazing job
Sentiment Analysis + Algo Trading = Profit? was originally published in Level Up Coding on Medium, where people are continuing the conversation by highlighting and responding to this story.
This content originally appeared on Level Up Coding - Medium and was authored by Nikhil Adithyan
Nikhil Adithyan | Sciencx (2023-05-08T03:22:39+00:00) Sentiment Analysis + Algo Trading = Profit?. Retrieved from https://www.scien.cx/2023/05/08/sentiment-analysis-algo-trading-profit/
Please log in to upload a file.
There are no updates yet.
Click the Upload button above to add an update.