
This content originally appeared on HackerNoon and was authored by HackerNoon Product Updates
Hey Hackers 💚
\ Our Story Stats Pages just got better! Let’s meet the updates.
\
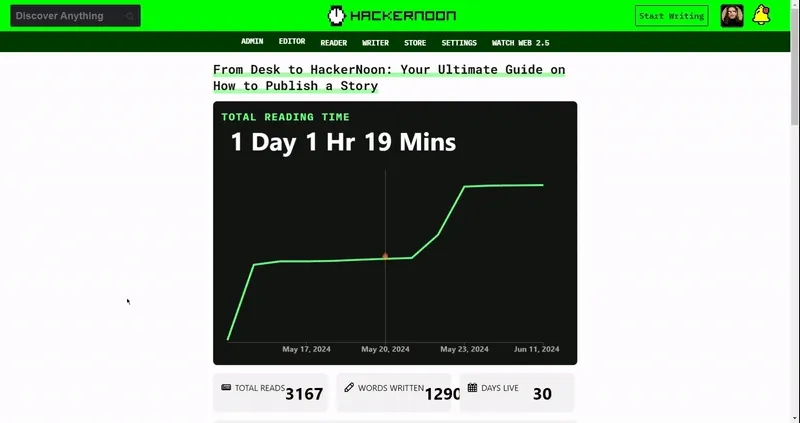
Bigger, Better Graphical Representation
Each story’s stats page features a graphical representation of the total time readers have spent on your story since its publication. With this new update, you can navigate the graph by date to see daily increases in reading time. Additionally, you can see if and when a story was trending on Tech Beat and its position in the rankings. Here’s what it looks like:
Stats Essentials
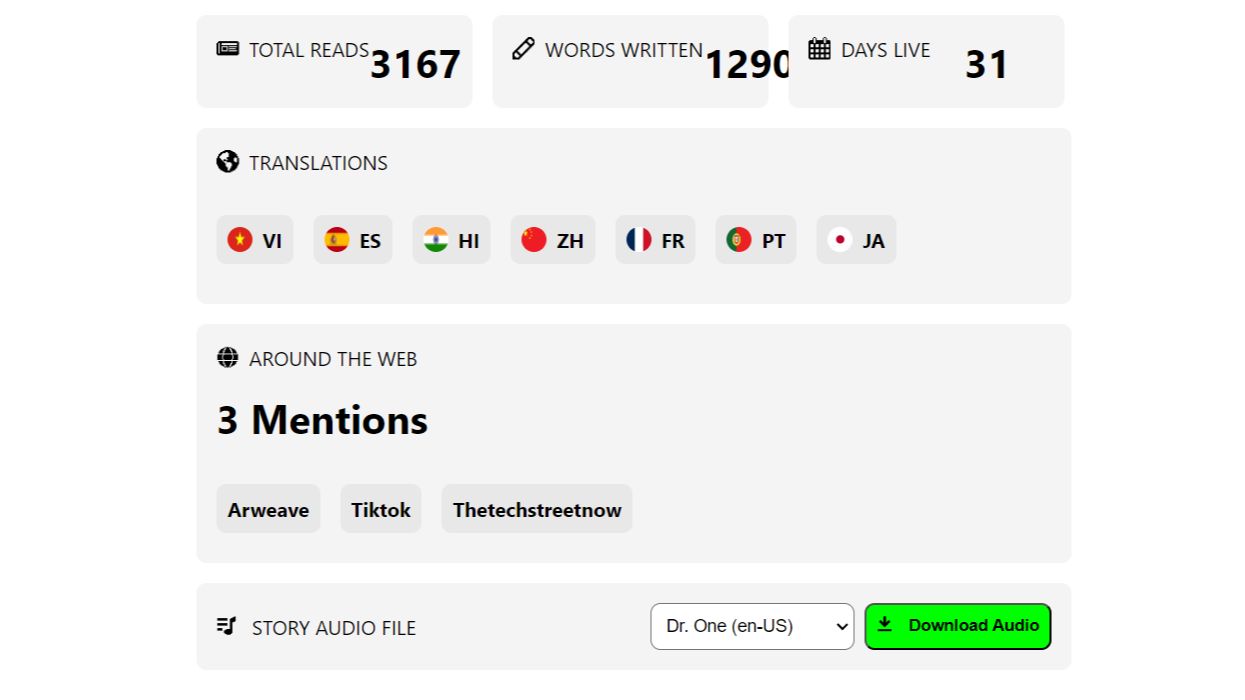
Just below the graph, you’ll find even more data:
Total Reads
Words Written
Days Live
Story Translation options
Around The Web: See all story mentions, fully clickable, in this section. Check it out for yourself—try this story.
Story Audio File: Download the story’s audio file with just one click—choose from our two voice-over options, Dr. One or Ms. Hacker, and start listening immediately.
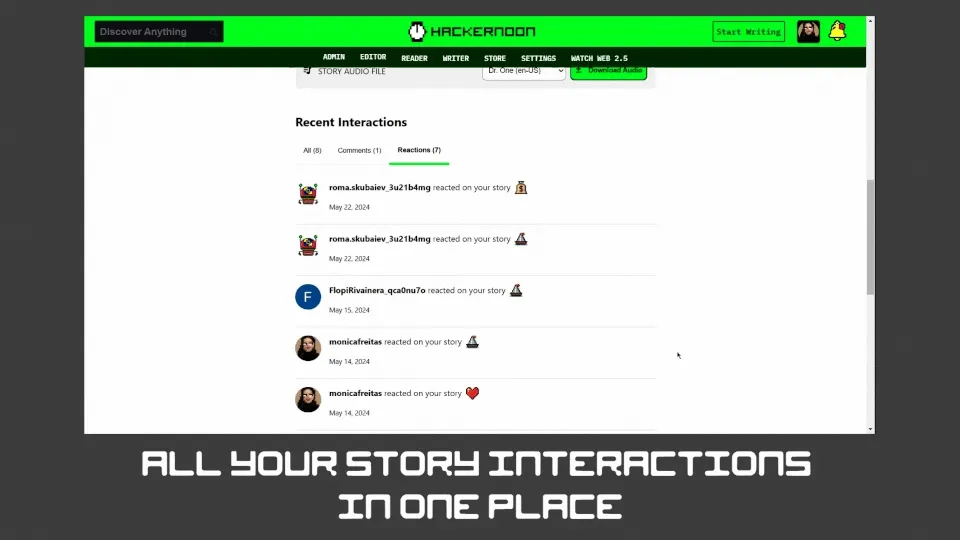
All Your Recent Interactions
To top it all off, check the bottom of the page for all your recent interactions, including comments and reactions!
Here’s an example:
Enjoy the new stats page!
This content originally appeared on HackerNoon and was authored by HackerNoon Product Updates
HackerNoon Product Updates | Sciencx (2024-07-02T14:00:16+00:00) Enhanced Story Data Now Available on HackerNoon Stats Pages. Retrieved from https://www.scien.cx/2024/07/02/enhanced-story-data-now-available-on-hackernoon-stats-pages/
Please log in to upload a file.
There are no updates yet.
Click the Upload button above to add an update.