This content originally appeared on DEV Community and was authored by Adam Furmanek
When running multi-tenant applications spanning hundreds of clusters and databases, it’s not uncommon to build extensive maintenance pipelines, monitoring, and on-call rotations to achieve database reliability. Many things can break, starting with bugs, inefficient queries written by developers, or inefficient configuration and indexing. Do you worry about your databases? You’re doing it wrong. Read on to see how to stop worrying and still have continuous database reliability.
What Breaks Around Databases
Many things can go wrong around databases. They are mostly about what we implement, how we deploy, what happens after the deployment, and later on during the lifetime of the database. Let’s dive into areas where things break to see more details.
What Breaks During Implementation
Developers need to implement complex queries. They often overfocus on the correctness of their business rules. They only check if the queries returned correct results or saved the proper data. They don’t verify the performance of the queries.
This leads to many issues. We may have inefficient queries that don’t use indexes, read too much data, or do not filter efficiently using sargable arguments. We may send too many queries when ORMs get the data lazily. We may use inefficient approaches like Common Table Expressions or overly complicated joins.
Other issues are related to the schema migrations. Adding columns or changing indexes may be as simple as one line of code change, but the migration may take hours to complete. We won’t know until we run the changes on the production database which may take our systems down for hours with no way of making this faster. Invalid migrations may also break the customers’ data which is detrimental to our business.
We need to be able to find these issues as early as possible. We typically try to find these issues during the deployment in many ways, but there is a better way. Read on to find out.
What Breaks During The Deployment
We test our applications well before deploying them to production. We have unit tests, integration tests, load tests, and other testing suites in our CI/CD pipelines. However, we run these things either with too small databases (often the case for unit tests), or we just run them too late.
Too small a database won’t help us find performance issues. We won’t see problems around slow schema migrations, inefficient queries, or too big datasets extracted from the database. We won’t notice that the performance is not acceptable. In non-production environments, we prefer to have simple and small databases to make tests faster and easier to maintain. However, this way we let problems go unnoticed. To avoid that, we have the load tests.
However, load tests happen way too late in the pipeline. When we identify the issue, we need to start the full cycle of development from scratch. We need to go back to the whiteboard, design a better solution, implement the code, review it within our teams, and then run through the pipelines again. This takes far too long. Not to mention, that it doesn’t capture all the issues because we often test with fake or inaccurate data that doesn’t reflect our production datasets. Load tests are also difficult to build and hard to maintain, especially when the application is stateful and we need to redact data due to GDPR.
This leads to the DevOps nightmare. We have slow processes with rollbacks and issues during deployment. However, we can avoid all the issues with load tests, increase velocity, avoid rollbacks, and have problems identified much earlier. Read on how to achieve that.
Recommended reading: You Must Test Your Databases And Here Is How
What Breaks After the Deployment
Once we deploy to production, things break again because we see the real data flowing in. We get different data distributions depending on the country, time of day, day of week, or time of year. Our solutions may work great in the middle of the week, but they fail miserably when Saturday night comes.
We identify these issues with metrics and alerts that let us know that CPU spikes or memory is exhausted. This is inefficient because it doesn’t tell us the reasons and how to fix the problems. We need to debug these things manually and troubleshoot them by ourselves.
What’s worse, this repeats over and over. This leads to long MTTR, increased communication, decreased quality, and overwhelming frustration. This could have been avoided, though.
What Breaks Later On
Once a perfectly fine query may stop working one day. Issues like this are the hardest to track because there is no clear error. We need to understand what happened and what changed in our operating systems, libraries, dependencies, configurations, and many other places. The query may break because of changes in indexing, outdated statistics, incompatible extensions, or simply because there is too much data in the database and the engine decides to run the query differently.
We rarely have solutions that can tell us in advance that something will break. We focus on “here and now”. We don’t see the future. What if I told you we can do differently?
What We Need and How Metis Achieves That
We need to prevent the faulty code from being deployed to production. We need alerts, notifications, and insights that will tell us when things won’t work in production or will be too slow. We need solutions that can show us how things interact with each other, how our configurations affect the performance, and how to improve the performance. Most importantly, this should be a part of our automated toolset so we don’t need to think about that at all. Something that covers our whole software development lifecycle, something that starts as early as we design solutions on the whiteboard, and helps us during the implementation, deployment, and maintenance later on. We need a solution that will reduce our MTTR, increase velocity and performance, and provide continuous reliability. Effectively, we want to forget our databases exist and focus on our business instead. Let’s see how Metis gives us all of that.
Metis provides database guardrails that can integrate with your programming flow and your CI/CD pipelines to automatically check queries, schema migrations, and how you interact with databases. Once you integrate with Metis, you get automated checks of all our queries during implementation. For instance, you run your unit tests that read from the database, and Metis checks if the queries will scale well in production. You don’t even need to commit your code to the repository.
Metis can analyze your schema changes. Metis analyzes the code modifying your databases and checks if the migrations will execute fast enough or if there are any risks.
Metis integrates with your CI/CD pipelines. You can use it with your favorite tools like GitHub Actions and get both performance and schema migrations checked automatically.
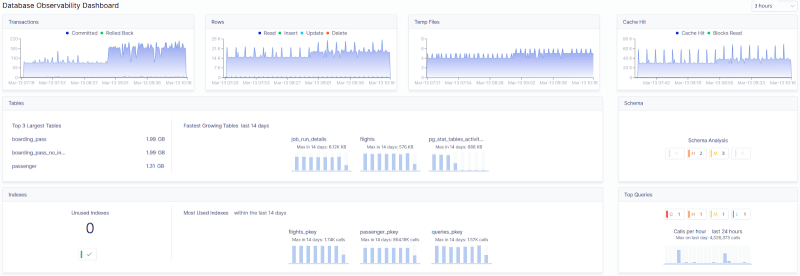
Metis truly understands how your database works. It can analyze database-oriented metrics around transactions, caches, index usage, extensions, buffers, and all other things that show the performance of the database.
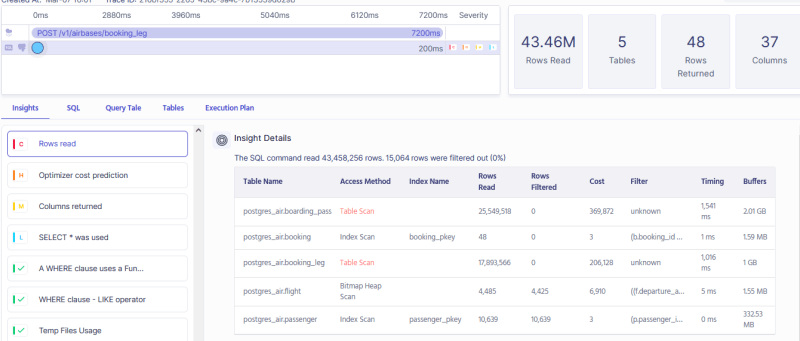
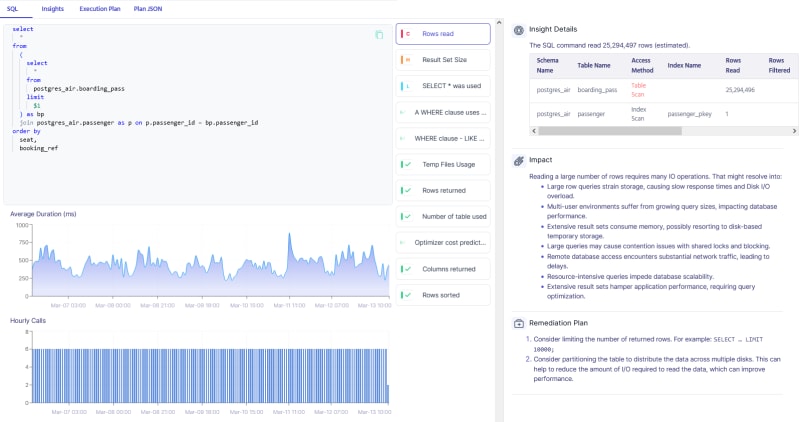
Metis analyzes queries and looks for anomalies. It can give you insights into how things behave over time, why they are slow, and how to improve performance. All of that is in real-time for the queries that come to your database.
Apart from metrics and queries, Metis understands everything database-related! It can reason about your indexes, settings, configurations, extensions, and schema.
Metis alerts you when things need your attention. Most of the issues can be fixed automatically. For issues that can’t be solved this way, Metis integrates with your platforms and tells you what is needed and how to do it. You don’t need to tune the alerts as Metis detects anomalies and knows when things break.
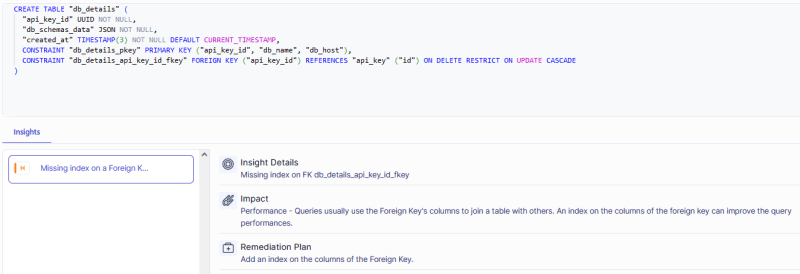
Metis analyzes the schema of your database. This way, Metis helps you write your applications better.
Metis walks you end-to-end through the software development life cycle. It covers everything from when you implement your changes until they are up and running in production. Metis unblocks your teams, gives them the ability to self-serve their issues, and keeps an eye on all you do to have your databases covered.
Summary
Achieving continuous database reliability is hard when we don’t have the right tools. We need to prevent the bad code from reaching production. We need to make sure things will scale well and will not take our business down. We need to continuously monitor our databases and understand how things affect each other. This is time-consuming and tedious. However, it’s automated with Metis. Once you integrate with Metis, you don’t need to worry about your database anymore. Metis covers your whole software development life cycle, fixes problems automatically, and alerts you when your attention is needed.
This content originally appeared on DEV Community and was authored by Adam Furmanek
Adam Furmanek | Sciencx (2024-07-04T08:00:00+00:00) From development to production what can go wrong with your databases (and how to avoid and fix them). Retrieved from https://www.scien.cx/2024/07/04/from-development-to-production-what-can-go-wrong-with-your-databases-and-how-to-avoid-and-fix-them/
Please log in to upload a file.
There are no updates yet.
Click the Upload button above to add an update.


