
This content originally appeared on HackerNoon and was authored by Kinetograph: The Video Editing Technology Publication
:::info Author:
(1) Melody Yu, Sage Hill School, California, USA.
:::
Table of Links
DATASET
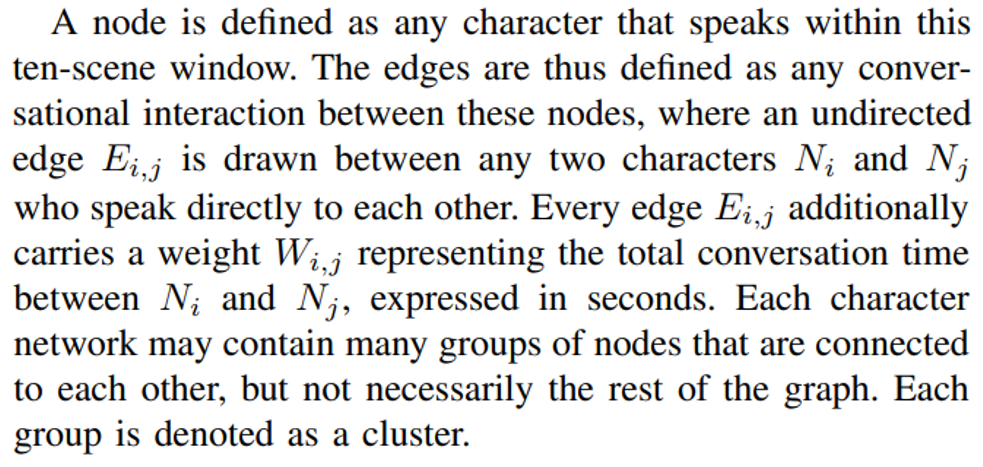
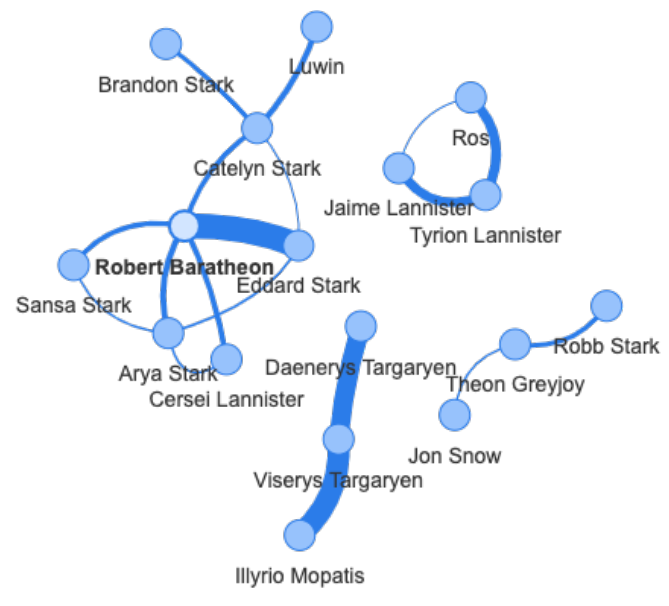
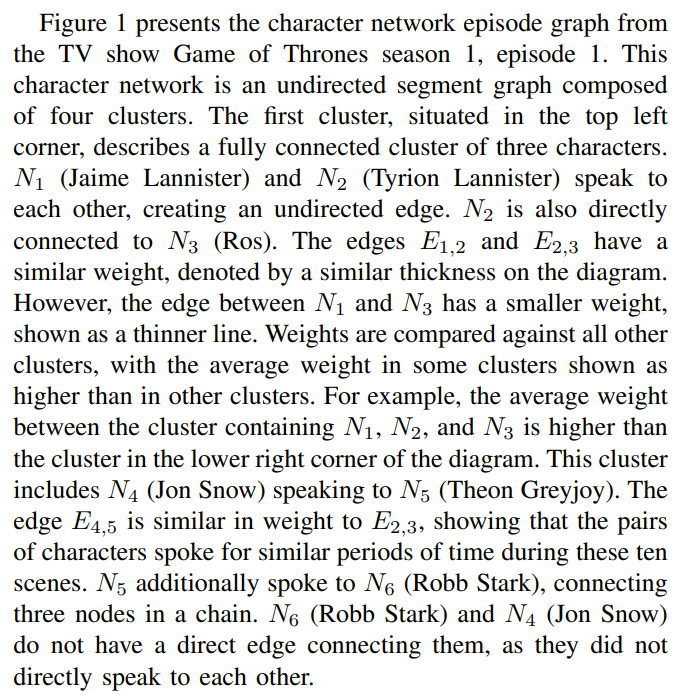
Our dataset is composed of character networks created by Bost. et. al. 2016 from three popular TV series. To capture a dynamic view of the character interactions, every episode’s character network is constructed by creating multiple successive static character networks.
\ A single-character network, also described as a segment graph or temporal graph, is defined as the interactions between characters over a period of ten scenes. Each episode contains multiple scenes, which means it can be split into multiple segment graphs. For the TV series Game of Thrones episode 1, 31 segment graphs are created from 310 scenes. Each graph of this episode contains between 14 and 17 nodes and 15 to 18 edges.
\
\
\
\ Our dataset is extracted from three popular TV series: Breaking Bad (seasons 1-2), Game of Thrones (seasons 1-5), and House of Cards (seasons 1-2).
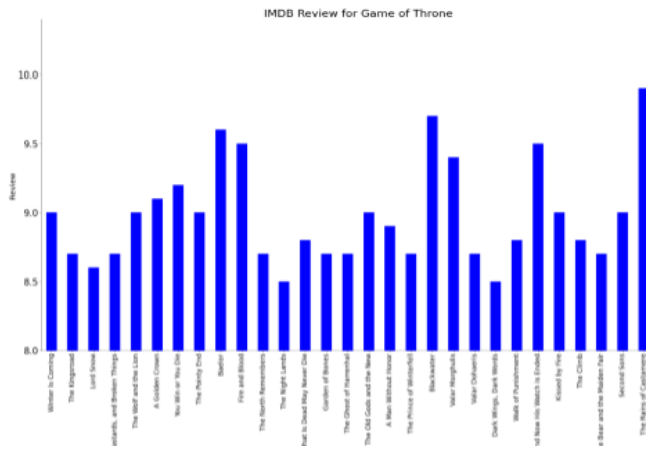
\ We additionally use the reviews of these shows from IMDb, an online database of information related to films and television series. Each review shows the average rating of an episode, represented by a decimal number between 1 and 10 with higher numbers representing more favorable or more liked episodes. IMDb’s reviews are formed by aggregating individual reviews from registered users. Users are allowed to cast one vote per episode.
\ It is important to note that IMDb ratings for TV show episodes reflect the overall quality of the episode, not just the character interactions and plot. Other factors such as special effects, guest stars, and cinematography may also influence the score given by viewers. It is possible that these additional elements contribute to the overall enjoyment of the episode and are therefore included in the rating.
\ Figure 2 shows the IMDb reviews of Season 1 of Game of Thrones. The x-axis is the name of the episode, while the y-axis is the IMDb review of the episode.
\
\
:::info This paper is available on arxiv under CC 4.0 license.
:::
\
This content originally appeared on HackerNoon and was authored by Kinetograph: The Video Editing Technology Publication
Kinetograph: The Video Editing Technology Publication | Sciencx (2024-07-05T11:00:27+00:00) Decoding the Popularity of TV Series: A Network Analysis Perspective: Dataset. Retrieved from https://www.scien.cx/2024/07/05/decoding-the-popularity-of-tv-series-a-network-analysis-perspective-dataset/
Please log in to upload a file.
There are no updates yet.
Click the Upload button above to add an update.