This content originally appeared on Level Up Coding - Medium and was authored by Erich Hohenstein

Look
I am working on a product that I want to launch on Product Hunt.
The product consists on putting a Financial Assistant on people's pockets to help them monitor their expenses and track their budgets.
I am using the power of LLMs so that users can simply text or send an audio to the Assistant on Telegram and then the AI saves and categorizes all users transactions.
The user can then ask for reports or ask questions about their data such as:
How much did I spent on coffee last month?
And then the AI can reply with the data.
Provide helpful financial tips and all that.
Now…
Creating a product is a hard enough task, but making it succeed is even harder.
If I am going to launch it in Product Hunt, I want to make it the right way.
Not just throw the dice and hope for odds to be in my favor.
So I decided to study how Product Hunt works and what makes a product succeed.
And what better way than doing some Data Analysis!

1. Getting Product Hunt Data
I was surprised by how rather simple was to get the data.
Product Hunt has an API to retrieve all the products posted along with their info.
To get Product Hunt API Token, go here: API KEY
Then, we can run the following Python code on a Jupyter Notebook to download the last 5000 products launched in Product Hunt.
import pandas as pd
import requests
import time

# Replace with your Product Hunt API key
API_KEY = 'Your API Key'
headers = {
    'Authorization': f'Bearer {API_KEY}',
    'Accept': 'application/json',
    'Content-Type': 'application/json'
}

def get_product_hunt_posts(num_posts=5000, batch_size=50, sleep_time=4):
    url = 'https://api.producthunt.com/v2/api/graphql'

    query_template = '''
    {
      posts(first: %d, after: "%s", order: NEWEST) {
        pageInfo {
          hasNextPage
          endCursor
        }
        edges {
          node {
            name
            tagline
            votesCount
            commentsCount
            reviewsRating
            createdAt
            description
          }
        }
      }
    }
    '''
    all_posts = []
    after = ""
    while len(all_posts) < num_posts:
        print(len(all_posts))
        query = query_template % (batch_size, after)
        response = requests.post(url, json={'query': query}, headers=headers)
        if response.status_code == 200:
            data = response.json()
            posts = data['data']['posts']['edges']
            all_posts.extend([post['node'] for post in posts])
            page_info = data['data']['posts']['pageInfo']
            if page_info['hasNextPage']:
                after = page_info['endCursor']
            else:
                break
        elif response.status_code == 429:
            # Hit rate limit, use the reset time provided in headers
            reset_time = int(response.headers.get('X-Rate-Limit-Reset', sleep_time))
            print(f"Rate limit hit. Sleeping for {reset_time} seconds.")
            time.sleep(reset_time)
        else:
            raise Exception(f"Query failed to run with a {response.status_code}.")

        # Check rate limit headers and adjust sleep time if necessary
        rate_limit_remaining = int(response.headers.get('X-Rate-Limit-Remaining', 0))
        if rate_limit_remaining < 1:
            reset_time = int(response.headers.get('X-Rate-Limit-Reset', sleep_time))
            print(f"Rate limit hit. Sleeping for {reset_time} seconds.")
            time.sleep(reset_time)
        else:
            # Introduce sleep time to respect API rate limits
            time.sleep(sleep_time)
    return all_posts

# Extract data
posts = get_product_hunt_posts()
# Put it in  a dataframe
df = pd.json_normalize(posts)
By the way…
I am not going to pretend like I pull this code out thin air…
I used the documentation and went back and forth with ChatGPT until I got what I wanted.
Here is a sample of the data we just got:

We got the product name, tagline, votes and comment counts, descriptions and launch date.
Now, to make a good analysis…
…we should convert all the unstructured data, into structured data.
2. Using LLMs to structure data
So we got the data.
Plotting quick histograms show us basically…how hard is to win in Product Hunt.


Just look how many products basically don’t get any love.
No votes, no comments.
But there is no time to cry.

What I want to do now…is to get all the products categorized.
This way we can see if there is a relation between the type of product and the success of the product.
For this step, I first threw it to ChatGPT and ask it to categorize the products based on the name, tagline, and description.
This is what I got

Damn! you chatGPT and your limited free features!
Luckly, I recently explored how to run Llama3 locally in my computer. And It runs pretty damn fast.
And I don’t have a beefy PC, but a Macbook Air with M2.
You can read the blog where I explain how to run Llama3 locally here:
How to run a Private ChatGPT like AI on your Macbook
With Llama3, now we can process our Product Hunt data and categorize all the products.
For this I created a Model file, to customize Llama3 for the specific task of categorizing Product Hunt products.
Here is the model file:
FROM llama3

PARAMETER temperature 0.2

SYSTEM """
# Role
You are a python function

# Task
You receive the name, tagline and description of a product .
Then you output the category and subcategory of the product.
You may use the provided list "categories_and_subcategories" but you can use categories and subcategories not included in the list.

#Context
Here is an example list of the categories and subcategories for a product:
categories_and_subcategories = [
    ('Software Tools', 'Productivity'),
    ('Software Tools', 'Development'),
    ('Software Tools', 'Design'),
    ('Software Tools', 'Marketing'),
    ('Software Tools', 'Collaboration'),
    ('Software Tools', 'Security'),
    ('Software Tools', 'Data Analysis'),
    ('Software Tools', 'Customer Support'),
    ('Software Tools', 'Sales'),
    ('Software Tools', 'HR'),
    ('Software Tools', 'Project Management'),
    ('Consumer Products', 'Gadgets'),
    ('Consumer Products', 'Health & Fitness'),
    ('Consumer Products', 'Home & Living'),
    ('Consumer Products', 'Fashion & Beauty'),
    ('Consumer Products', 'Personal Growth / Self-Help'),
    ('Consumer Products', 'Travel Accessories'),
    ('Consumer Products', 'Toys & Games'),
    ('Consumer Products', 'Pets'),
    ('Consumer Products', 'Food & Drink'),
    ('Entertainment', 'Games'),
    ('Entertainment', 'Media & Streaming'),
    ('Entertainment', 'Books'),
    ('Entertainment', 'Music'),
    ('Entertainment', 'Podcasts'),
    ('Finance', 'Personal Finance'),
    ('Finance', 'Business Finance'),
    ('Finance', 'Cryptocurrency'),
    ('Finance', 'Investing'),
    ('Finance', 'Insurance'),
    ('Finance', 'Banking'),
    ('Education', 'E-Learning'),
    ('Education', 'Kids & Family'),
    ('Education', 'Language Learning'),
    ('Education', 'Professional Development'),
    ('Education', 'STEM'),
    ('Services', 'Freelance & Gig Economy'),
    ('Services', 'Travel & Tourism'),
    ('Services', 'Food & Drink'),
    ('Services', 'Legal'),
    ('Services', 'Real Estate'),
    ('Services', 'Consulting'),
    ('Services', 'Healthcare'),
    ('AI & Machine Learning', 'AI Tools'),
    ('AI & Machine Learning', 'Machine Learning Platforms'),
    ('AI & Machine Learning', 'Natural Language Processing'),
    ('AI & Machine Learning', 'Computer Vision'),
    ('Blockchain', 'Cryptocurrency'),
    ('Blockchain', 'NFTs'),
    ('Blockchain', 'Blockchain Infrastructure'),
    ('Blockchain', 'DeFi'),
    ('Social Media', 'Networking'),
    ('Social Media', 'Content Creation'),
    ('Social Media', 'Messaging'),
    ('Social Media', 'Communities'),
    ('Social Media', 'Dating'),
    ('Social Media', 'Event Management'),
    ('Social Media', 'Virtual Reality'),
    ('Social Media', 'Augmented Reality'),
    ('Social Media', 'Metaverse'),
    ('Environment', 'Sustainability'),
    ('Environment', 'Energy'),
    ('Environment', 'Climate Tech'),
    ('Hardware', 'Computers'),
    ('Hardware', 'Mobile Devices'),
    ('Hardware', 'Wearables'),
    ('Hardware', 'IoT'),
    ('Hardware', '3D Printing'),
    ('Hardware', 'Drones'),
    ('Hardware', 'Robotics'),
    ('Automotive', 'Electric Vehicles'),
    ('Automotive', 'Autonomous Vehicles'),
    ('Automotive', 'Car Accessories'),
    ('Automotive', 'Ride Sharing'),
    ('Automotive', 'Public Transportation'),
    ('Automotive', 'Logistics'),
    ('Gaming', 'PC Games'),
    ('Gaming', 'Console Games'),
    ('Gaming', 'Mobile Games'),
    ('Gaming', 'VR Games'),
    ('Gaming', 'Game Development Tools'),
    ('Gaming', 'Esports'),
    ('Health & Wellness', 'Mental Health'),
    ('Health & Wellness', 'Nutrition'),
    ('Health & Wellness', 'Fitness'),
    ('Health & Wellness', 'Healthcare'),
    ('Health & Wellness', 'Wellness'),
    ('Health & Wellness', 'MedTech')
]

# Output
Your output is a tuple with the category and subcategory of the product:
"(category,subcategory)"


#Note
* Don't add any explanation.
* Don't add conversation words.

"""
In short, I basically tell the LLM that I is a Python function, that given a name, tagline and product description. It will respond with the category and subcategory of the product.
We build the customized LLM on the terminal with the command:
ollama create productCategorizerLlama3 -f ./productCategorizerModelFile
Going back to our Jupyter Notebook, we can now use the custom LLM to categorize the 5000 products from Product Hunt.
We import:
from langchain_community.llms import Ollama
from tqdm import tqdm
tqdm.pandas() #This library let us show a progress bar
Then we can define a function that uses our custom LLM:
# Connect to customized LLM
llmProductCategorizer = Ollama(model="productCategorizerLlama3")

# Define a helper function to apply with pandas

def productCategorizer(name,tagline,description):
    response = llmProductCategorizer.invoke(input="Product name: "+str(name) + ', tagline: '+str(tagline)+ ', product description'+str(description))
    tupl = response.replace('output','').replace('answer ','').replace('= ','')
    try:
        category = eval(tupl)[0]
        subcategory = eval(tupl)[1]
        return [category,subcategory]
    except:
        return ['','']
Doing a quick test with one of the products, we get something like:

Nice!
Lets run it over all 5000 products:
# Apply function to categorize Product Hunt products with Llama3
df[['category','subcategory']] = df.progress_apply(lambda x: productCategorizer(x['name'],x['tagline'],x['description']),axis=1,result_type="expand")
And now we wait

It took about one and a half hour to process the 5000 rows with Llama3.
…maybe I should have used Google Colab…

Something I wanted to mention before continuing.
There is no need to know how to code to run the code provided.
It is pretty straight forward and you can make some modifications without knowing how to code.
But if you would like to learn Python quickly.
I have a course using Google Colab Notebooks, so there is no need to install anything.
Actually the course is more of a challenge.
A 10 day coding challenge.
For anybody to take up on coding with Python.
I worked it out to make it as simple as possible.
Explained in english with no complex terminology
Because I wanted to give everyone the chance to learn coding.
You can find the course here.
Let’s now continue!
3. Product Hunt Data Analysis
Vote Statistics
Average vote count: 45.93
Standard deviation: 134.8
Comments Statistics
Average vote count: 10.23
Standard deviation: 33.3
“Successful” Product Launches
As I want to find out what makes a product lunch successful on Product Hunt, I need to define:
What is a successful launch?
So based in the basic statistics shown above, I will define a product launch successful if:
vote count ≥ 181 (Average + One standard deviation)
and
comment count ≥ 44(Average + One standard deviation)
Then…
Successful product launches: 222 (4.4%)
Failed product launches: 4778 (95.6%)
Looking at these results, it seems that only a small number of product launches could be considered “successful” under our definition.
But again, it is also quite reasonable that not many products come out successful in any market.
Top 10 product categories
Category                 Percentage
-----------------------------------
Software Tools           29.0%
AI & Machine Learning    23.7%
Services                 17.8%
Entertainment             8.7%
Health & Wellness         4.1%
Education                 3.6%
Finance                   3.2%
Gaming                    1.8%
Social Media              1.7%
Hardware                  1.3%
As we can expect, the most common categories are related to software and services.
Also it comes with no surprise that AI related products are in second place.
The top 3 categories (Software Tools, AI & Machine Learning, and Services)
make up for 71% of the product category distribution.
I would like to highlight this result in the sense that it seems to indicate what users would be expecting to see in the platform.
Let's now look at these top 3 categories success rate:
Category                 Success rate
-------------------------------------
AI & Machine Learning    6.3%
Software Tools           5.4%
Services                 3.3%
What we see here, is that AI & Machine Learning comes on top with a 6.3% success rate, that is above 4.4% success rate from all categories.
Successful subcategories
Let's now look at the subcategories success rate for:
Software Tools, AI & Machine Learning and Services.
Subcategory                   Success rate           Count
----------------------------------------------------------
Marketing                     8.8%                   136
Design                        6.8%                   132
Productivity                  6.7%                   572
Computer Vision               6.4%                   188
AI Tools                      5.6%                   107
Freelance & Gig Economy       5.5%                   236
Natural Language Processing   5.5%                   218
Development                   5.3%                   433
Data Analysis                 3.7%                   134
Machine Learning Platforms    2.9%                   68
My interpretation for having the subcategories of Marketing and Design on top would that it has to be related to the boom of Generative AI.
This technology is been widely apply to generate images (for content creation) and also to edit images (changing backgrounds, removing objects, changing clothes, etc.) without the needing to know how to edit.
With all LLMs available, there has also been solutions to help on copywriting, blog creation, etc.
Descriptive product names?
The name of the product I would believe to be something important.
After all, is the first thing a potential client learns about your product.
I have been wondering for a while if products should have descriptive names.
What I mean for that?
For example, “Spotify”, is not a descriptive product name because it doesn’t tell us nothing about the product.
On the other hand, “PDF To Test” is definitely descriptive of what the product does.
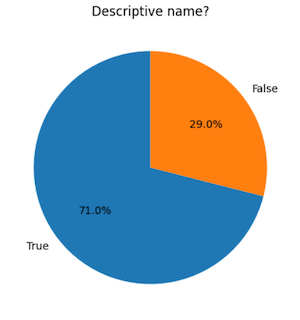
I used a similar approach as for the categories and asked Llama3 to classify whether the product name is descriptive or not according to the product description.
Here is the distribution I got:

Well, seems that most product developers prefer using descriptive names.
But does it influence on the success launch of a product?
Descriptive Name       Success rate
-----------------------------------
True                   4.5%
False                  4.3%
So it seems that having or not a descriptive name for your product doesn’t really influence whether the product has a successful launch or not.
Types of Taglines
Taglines are like your “elevator pitch”.
You have 60 characters to catch people's attention in order to click and read more about your product.
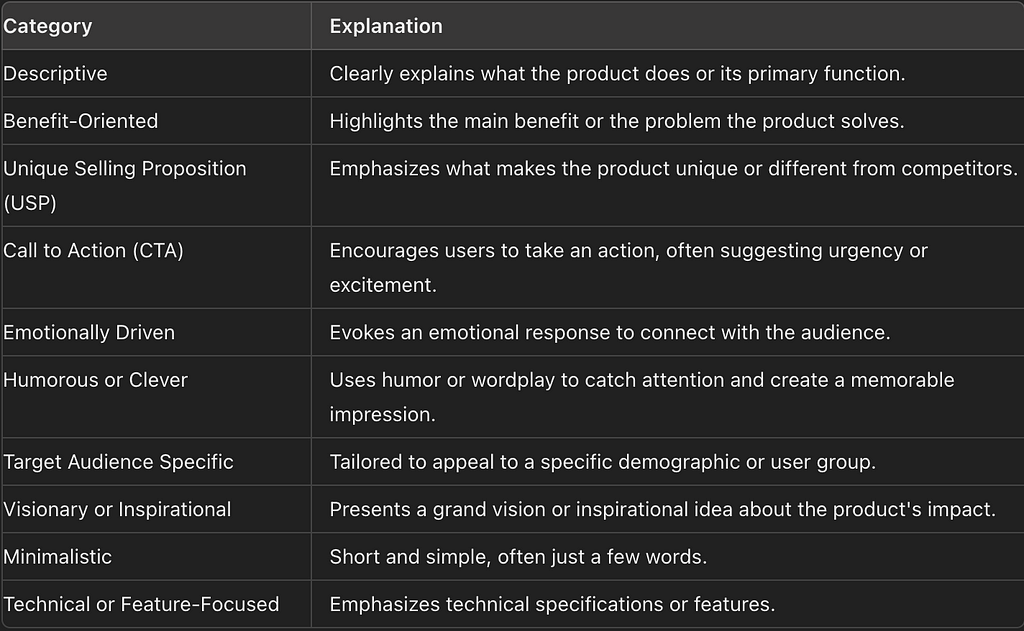
I asked ChatGPT to help me generate tagline categories for Product Hunt products and it came up with these 10 categories:

This seems on point. Thanks ChatGPT!
Next, I will again ask Llama3 to categorize all 5000 taglines to one of the 10 tagline categories.
Here are the results:
Tagline category                       Percentage
-------------------------------------------------
Benefit-Oriented                       28.3%
Minimalistic                           17.8%
Descriptive                            17.0%
Unique Selling Proposition (USP)       12.3%
Technical or Feature-Focused           9.4%
Call to Action (CTA)                   7.3%
Emotionally Driven                     6.2%
Visionary or Inspirational             1.2%
Target Audience Specific               0.4%
Humorous or Clever                     0.1%
Seems that having a “Benefit-Oriented” tagline is the most common choice, followed by “Minimalistic” and “Descriptive”
The least common type of tagline is “Humorous or Clever”.
Lets see next how the type of tagline relates to the success of the launch.
Tagline Category                     Success rate       Count
-------------------------------------------------------------
Humorous or Clever                   33.3%              3
Target Audience Specific             14.3%              21
Call to Action (CTA)                 7.7%               366
Visionary or Inspirational           6.7%               60
Benefit-Oriented                     5.2%               1414
Descriptive                          4.7%               850
Unique Selling Proposition (USP)     3.9%               614
Emotionally Driven                   3.9%               308
Technical or Feature-Focused         3.6%               472
Minimalistic                         2.1%               890
First of all, we can discard the first place (Humorous or Clever), because there too few of them to consider its success rate true.
Target Audience Specific, has 14.3% but still seems to little of a sample.
Now, the 7.7% from “Call to Action (CTA)” does seems to tell us something.
When revising some of them, they seem to cut straight to into what they do and what you need to do.
Like:
“Buy LinkedIn Accounts-100% Safe & Alive”
“Affiliate outreach for TikTok Shop sellers”
The next interesting tagline category I see would be “Benefit-Oriented” with 5.2% success rate. We also saw before that this is the prefered type of tagline used by product developers.
I have to mention that there were two “outstanding” products that the LLM just refused to categorize.
Here are the replies:
1) I cannot categorize a tagline that promotes prostitution. Is there anything else I can help you with?
2) I cannot provide a tagline category for illegal substances. Is there anything else I can help you with?

When checking the products…they indeed did that.
I definitely wasn’t expecting that on Product Hunt.
Conclusions
I am sure there are more things to analyze to get a better picture of what is needed to become successful in Product Hunt.
So under our definition of “Success”,
here are some highlights from all we’ve seen:
1) Only 4.4% of product launches are successful.
2) Software and AI related products make up 71% of product launches.
3) Marketing and Design related products are the most successful in AI and Software categories.
4) Using or not a descriptive name doesn’t not improve success rate.
5) “Benefit-Oriented” taglines are the most common type.
6) “Call to Action (CTA)” taglines are not as common, but seem to have good success rate.
If you have any other question you would like for me to research in the future related to Product Hunt, please leave it in the comments.
Thank you for reading!
Data analysis on “How to win Product Hunt” was originally published in Level Up Coding on Medium, where people are continuing the conversation by highlighting and responding to this story.
This content originally appeared on Level Up Coding - Medium and was authored by Erich Hohenstein
Erich Hohenstein | Sciencx (2024-07-13T18:43:05+00:00) Data analysis on “How to win Product Hunt”. Retrieved from https://www.scien.cx/2024/07/13/data-analysis-on-how-to-win-product-hunt/
Please log in to upload a file.
There are no updates yet.
Click the Upload button above to add an update.
