This content originally appeared on DEV Community and was authored by Leon Adato
The technology commonly referred to as “NetFlow,” by which I include everything from Cisco’s eponymous protocol, to JFlow, sFlow, and even VPC Flow Logs on AWS, is possibly one of the most essential techniques that fall under the umbrella of observability overall, and network observability in particular.
The challenge is that, while many can appreciate its importance, NetFlow is a technology that’s been frustratingly difficult to try out or test in a lab or sandbox environment without a significant amount of time, expertise, and preparation.
At least, that’s always been my experience in the past.
It turns out that the Kentik Kappa agent allows for the easy setup and collection of NetFlow metrics on everything from Kubernetes clusters to bare metal Linux boxes. So today I want to show you how, in a few steps, you can set up a lab box, along with a free Kentik account, and see how NetFlow is both different from and vastly superior to the network metrics you may be used to seeing in other monitoring and observability solutions.
Step 1: Get a Kentik account
The good news is this is an easy step, and you may have already done it!
On the off chance you don’t have a Kentik account yet, head over to the sign up page, fill in a few fields, and you’ll be up and running in no time.
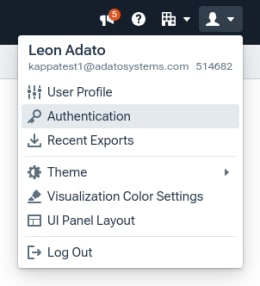
There’s only one other essential step. Once you’re logged into your fresh new Kentik account, go to the account menu (the “head” in the upper right corner) and click “Authentication.”
From that screen you’ll see an API Token. Copy it and put it somewhere for safe keeping because you’ll need it further down in this process.
Step 2: Get a Linux box to test on
Next, you’ll need a machine to test this out on. Honestly, it doesn’t matter (to me) if this is your personal machine, a box sitting under your desk, a virtual machine running in VirtualBox or VMWare, a Docker container, or something else.
In the example below, I’m using Ubuntu 22.04 running in VirtualBox. But you’re welcome to salt to taste.
Step 3: Download, install, and configure the Kentik Kappa agent
The Kappa agent for Kentik can be found in this repository: https://packagecloud.io/kentik/kappa.
Find the link that matches your OS and version, and click the “Install” button on the right. While there are commands to install via the package manager, my experience is that people log into systems with accounts that may or may not have the correct level of built-in access (read “not root”) to get the job done correctly. Therefore, I recommend using the wget command to pull down the file, and then using either sudo rpm -ivh (for .rpm files) or sudo dpkg -i (for .deb files) to do the actual installation.
Once installed, you need to configure the agent so it connects this machine with your Kentik account. Using your favorite editor, and open up /etc/default/kappa. It should look like this:
- For KENTIK_EMAIL=, enter the email you used to sign up for your Kentik account.
- After KENTIK_TOKEN= you should paste the API key I asked you to remember in step 1.
- Believe it or not, KENTIK_DEVICE= is going to matter a lot. You can put anything you want (it doesn’t have to match the actual hostname), but you’ll need to keep track of whatever you put here for later in the process
- For KENTIK_REGION=, use either “US” or “EU” (without the quotes)
When done, your config file should look something like this:
One last thing: Before we move to the next step, make a note of the device IP address.
While we’ll need to come back to this system to restart the Kappa agent, we’re putting that step on hold for just a second and moving on to…
Step 4: Add the device to Kentik
Back in your Kentik portal, click the hamburger menu in the upper left corner, then Settings, and then choose Network Devices. This will take you to a screen where you can add your first network device.
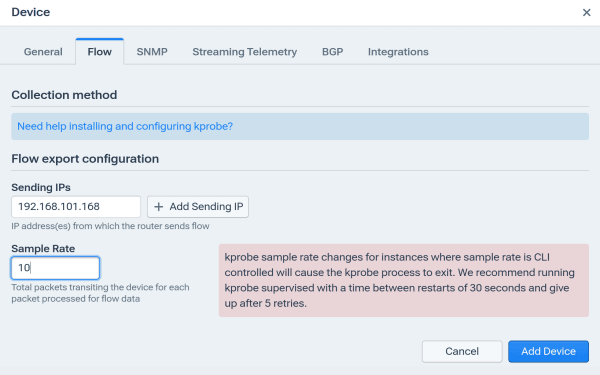
Clicking the friendly blue Add Device button in the upper right area of the screen will reveal a popup with several tabs or steps.
- Starting on the General tab, put in the name of the device. Remember that this has to match the name you put in the configuration file in step 3!
- Change the type from NetFlow-Enabled Router to Kentik Host Agent (kprobe).
- Finally (for this section) select a billing plan. For this test, the Free Trial Plan should be fine.
- The description, site, and label elements are optional.
Do not click Add Device. Instead, click Flow from the tabs at the top.
On this screen you’ll add the IP address (as noted in step 3) and set the sample rate. Our recommendation is that 10 is a good initial setting, and you can adjust up (for less detail) or down (for more) once you have a sense of both the granularity you need as well as the cost impact.
(Step 3: The missing link)
As mentioned, we have one last task back on the test machine itself: restarting the Kappa agent.
The right way to do this is to both restart the agent and set it to automatically start after every reboot. The commands to do that are:
sudo systemctl enable kappa-agg.service

sudo systemctl enable kappa-agent.service

sudo systemctl start kappa-agg.service

sudo systemctl start kappa-agent.service
Note that these are Ubuntu-specific commands so you’ll need to adjust for an RPM-based system.
Step 5: Explore your NetFlow
At this point, the Kappa agent should be sending NetFlow data to Kentik, such as it is. I mean, this is a test system so it’s probably not sending much in the way of network traffic. In order to see it, click the hamburger menu in the upper left corner and select Data Explorer.
Don’t panic! I know your screen doesn’t look like this. Yet. You just have to tweak a few settings:
- Add two dimensions
- Device
- Application
- Change the Visualization Type to Sankey
You did it! What now?
With that done (and possibly after waiting a bit for some actual data to flow), you should be ready to explore the awe-inspiring, eye-opening, insight-revealing world of NetFlow!
What comes next is a bit of a “choose your own adventure” situation. You may want to set up various applications on this test system, and then see what NetFlow shows you about how it’s performing and where the application is connecting. Or you might be ready to add more devices (network, server, or otherwise) to your Kentik test account and see how the network observability data from all those devices combine to show a bigger picture of your infrastructure performance and stability.
Or you might be ready to jump into this network observability thing feet-first, setting up a full (non-trial) Kentik account and adding your production devices.
The choice is yours, and we here at Kentik eagerly await whatever lies in store for you next!
This content originally appeared on DEV Community and was authored by Leon Adato
Leon Adato | Sciencx (2024-07-29T14:00:00+00:00) Exploring NetFlow with Kentik: A Simple Explainer. Retrieved from https://www.scien.cx/2024/07/29/exploring-netflow-with-kentik-a-simple-explainer/
Please log in to upload a file.
There are no updates yet.
Click the Upload button above to add an update.


