This content originally appeared on HackerNoon and was authored by Sreejith
\ Welcome to the final part of the series. In this article, we will explore how to detect high traffic anomalies using Spring State Machine (SSM) and Spring Reactor.
\
Series began with an examination of keyword-based detection in part1. Then we focused on techniques that utilize error rate analysis in part2.
\ Let’s explore how these components come together to build a comprehensive monitoring solution. First, we’ll build high traffic anomaly detection and then integrate the detection with the previously established systems. This integration will enhance the overall effectiveness of our monitoring framework. By combining these elements, we create a robust system capable of detecting anomalies in real-time.
\ \ \ Step 1: Update the existing model
\
- LogEvent:
\ Update the LogEvent to include a high traffic rate event (i.e., HIGH_TRAFFIC).
\
public enum LogEvent {
            KEYWORD_DETECTED, HIGH_FREQUENCY, HIGH_ERROR_RATE, NORMAL_ACTIVITY
}
\
- KEYWORD_DETECTED: Triggered when a specific keyword or pattern is found in a log message.
- HIGH_FREQUENCY: Indicates an unusually high number of log entries in a short time period.
- HIGHERRORRATE: Signifies an elevated rate of error messages.
- NORMAL_ACTIVITY: Represents standard, expected log patterns.
\ \
- LogState:
\ Update the LogState to include high traffic traffic rate.
\
public enum LogState {
    NORMAL, KEYWORD_ALERT, FREQUENCY_ALERT, ERROR_RATE_ALERT
}
\
NORMAL: The default state when no anomalies are detected.
KEYWORD_ALERT: Entered when a keyword triggering an alert is detected.
FREQUENCY_ALERT: Indicates an unusual spike in log entry frequency.
ERRORRATEALERT: Signifies an elevated error rate in recent log entries.
\
Step2: Update state transition
\ The system operates in various states, primarily starting in a NORMAL state. It transitions to different alert states based on specific events. When a KEYWORDDETECTED event occurs, the system moves from NORMAL to KEYWORDALERT. Similarly, a HIGHFREQUENCY event triggers a shift from NORMAL to FREQUENCYALERT. If a HIGHERRORRATE event is detected, the system transitions from NORMAL to ERRORRATEALERT. Regardless of which alert state the system is in (KEYWORDALERT, FREQUENCYALERT, or ERRORRATEALERT), it returns to the NORMAL state upon receiving a NORMAL_ACTIVITY event.
\
    @Override
    public void configure(StateMachineTransitionConfigurer<LogState, LogEvent> transitions) throws Exception {
        transitions
            .withExternal()
                .source(LogState.NORMAL).target(LogState.KEYWORD_ALERT)
                .event(LogEvent.KEYWORD_DETECTED)
            .and()
            .withExternal()
                .source(LogState.NORMAL).target(LogState.FREQUENCY_ALERT)
                .event(LogEvent.HIGH_FREQUENCY)
            .and()
            .withExternal()
                .source(LogState.NORMAL).target(LogState.ERROR_RATE_ALERT)
                .event(LogEvent.HIGH_ERROR_RATE)
            .and()
            .withExternal()
                .source(LogState.KEYWORD_ALERT).target(LogState.NORMAL)
                .event(LogEvent.NORMAL_ACTIVITY)
            .and()
            .withExternal()
                .source(LogState.FREQUENCY_ALERT).target(LogState.NORMAL)
                .event(LogEvent.NORMAL_ACTIVITY)
            .and()
            .withExternal()
                .source(LogState.ERROR_RATE_ALERT).target(LogState.NORMAL)
                .event(LogEvent.NORMAL_ACTIVITY);
    }
\ \ Step3: Detect High Traffic anomaly
\ Below method checks if the traffic rate for a given IP address exceeds a predefined threshold. If the frequency count exceeds the threshold, it sends a `HIGH_FREQUENCT` event to the provided state machine. Then Spring State Machine process the transaction to transforms it to desired response.
\
private Mono<AnomalyResult> detectHighTraffic(LogEntry entry, StateMachine<LogState, LogEvent> stateMachine,
            ConcurrentHashMap<String, Integer> ipFrequencyMap) {
        if (ipFrequencyMap.get(entry.ipAddress()) > frequencyThreshold) {
            Mono<Message<LogEvent>> event = Mono.just(MessageBuilder.withPayload(LogEvent.HIGH_FREQUENCY).build());

            Flux<StateMachineEventResult<LogState, LogEvent>> results = stateMachine.sendEvent(event);

            return results.next().flatMap(result -> {
                if (result.getResultType() == StateMachineEventResult.ResultType.ACCEPTED) {
                    return Mono.just(new AnomalyResult(entry, LogState.FREQUENCY_ALERT));
                } else {
                    return Mono.empty();
                }
            });
        } else {
            return Mono.empty();
        }
    }
\ Keep track of high traffic occurrence:
\ The system utilizes two distinct maps to monitor IP address activity. The ipFrequencyMap keeps a tally of all log entries associated with each IP address, incrementing the count for the respective IP address with every new log entry, regardless of its nature. In parallel, the ipErrorMap specifically focuses on error-related entries. It maintains a count of error occurrences for each IP address, only increasing the tally when a log entry is identified as an error. This dual tracking system allows for comprehensive monitoring of both overall activity and error-specific patterns for each IP address.
\ \
    private void updateOccurrence(LogEntry entry, ConcurrentHashMap<String, Integer> ipFrequencyMap,
            ConcurrentHashMap<String, Integer> ipErrorMap) {
        ipFrequencyMap.compute(entry.ipAddress(), (key, value) -> (value == null) ? 1 : value + 1);

        if (entry.isError()) {
            ipErrorMap.compute(entry.ipAddress(), (key, value) -> (value == null)  ? 1 : value + 1);
        }
    }
\ \ Step4: Integrate all the detection techniques
\
This method implements a cascading anomaly detection strategy for each log entry by sequentially applying multiple checks. It begins by assessing the log for a high error rate using the detectHighErrorRate function. If no significant error rate is found, the method then checks for abnormal frequency using the detectHighFrequency function. Should the frequency appear normal, the next step involves searching for keyword-based anomalies with the detectKeyword function. If none of these checks indicate an anomaly, the method concludes by returning NORMAL state.
\
    private Mono<AnomalyResult> detectAnomaly(LogEntry entry, StateMachine<LogState, LogEvent> stateMachine,
            ConcurrentHashMap<String, Integer> ipFrequencyMap, ConcurrentHashMap<String, Integer> ipErrorMap) {
        return
            detectHighErrorRate(entry, stateMachine,ipErrorMap )
            .switchIfEmpty(detectHighTraffic(entry, stateMachine, ipFrequencyMap))
            .switchIfEmpty(detectKeyword(entry, stateMachine))
            .switchIfEmpty(Mono.just(new AnomalyResult(entry, LogState.NORMAL)));
    }
\ \ Step5: Process Log files:
\
The processLogsForGivenWindow method is designed to process log entries within a specified time window, applying anomaly detection through a state machine. First, it initializes a state machine instance using stateMachineFactory.getStateMachine() and creates two concurrent hash maps: one (ipFrequencyMap) to track the frequency of occurrences for each IP address, and another (ipErrorMap) to monitor the number of error entries associated with each IP address.
\
The method begins by starting the state machine reactively with stateMachine.startReactively(). It then processes the stream of log entries provided by the entries Flux. For each log entry, the updateOccurrence method is called, which updates the frequency and error counts in the respective hash maps. Following this, the detectAnomaly method is invoked, which uses the state machine and the updated maps to identify any anomalies in the log data. Once all log entries have been processed, the state machine is stopped reactively using stateMachine.stopReactively(). The result is a Flux of AnomalyResult objects, representing the detected anomalies within the given log entries.
\
    private Flux<AnomalyResult> processLogsForGivenWindow(Flux<LogEntry> entries) {
        StateMachine<LogState, LogEvent> stateMachine = stateMachineFactory.getStateMachine();
        ConcurrentHashMap<String, Integer> ipFrequencyMap = new ConcurrentHashMap<>();
        ConcurrentHashMap<String, Integer> ipErrorMap = new ConcurrentHashMap<>();

        return stateMachine.startReactively()
        .thenMany(entries.doOnNext(entry -> updateOccurrence(entry, ipFrequencyMap, ipErrorMap))
        .flatMap(entry -> detectAnomaly(entry, stateMachine, ipFrequencyMap, ipErrorMap)))
        .doFinally(signalType -> stateMachine.stopReactively());
    }
\ Step6: Expose as an API
\
The AnomalyDetectionController is a Spring Boot REST controller that handles HTTP POST requests for detecting anomalies in log data. It relies on an injected AnomalyDetectionService to perform the actual detection. When a POST request is made to the /detect-anomalies endpoint with a Flux of log entries in the request body, the detectAnomalies method is triggered. This method passes the received log entries to the AnomalyDetectionService, which processes the data and returns a reactive stream (Flux) of AnomalyResult objects, representing any detected anomalies.
\
@RestController
public class AnomalyDetectionController {

    private final AnomalyDetectionService anomalyDetectionService;

    public AnomalyDetectionController(AnomalyDetectionService anomalyDetectionService) {
        this.anomalyDetectionService = anomalyDetectionService;
    }

    @PostMapping("/detect-anomalies")
    public Flux<AnomalyResult> detectAnomalies(@RequestBody Flux<LogEntry> logEntries) {
        return anomalyDetectionService.detectAnomalies(logEntries);
    }

}
\ Step7: Testing
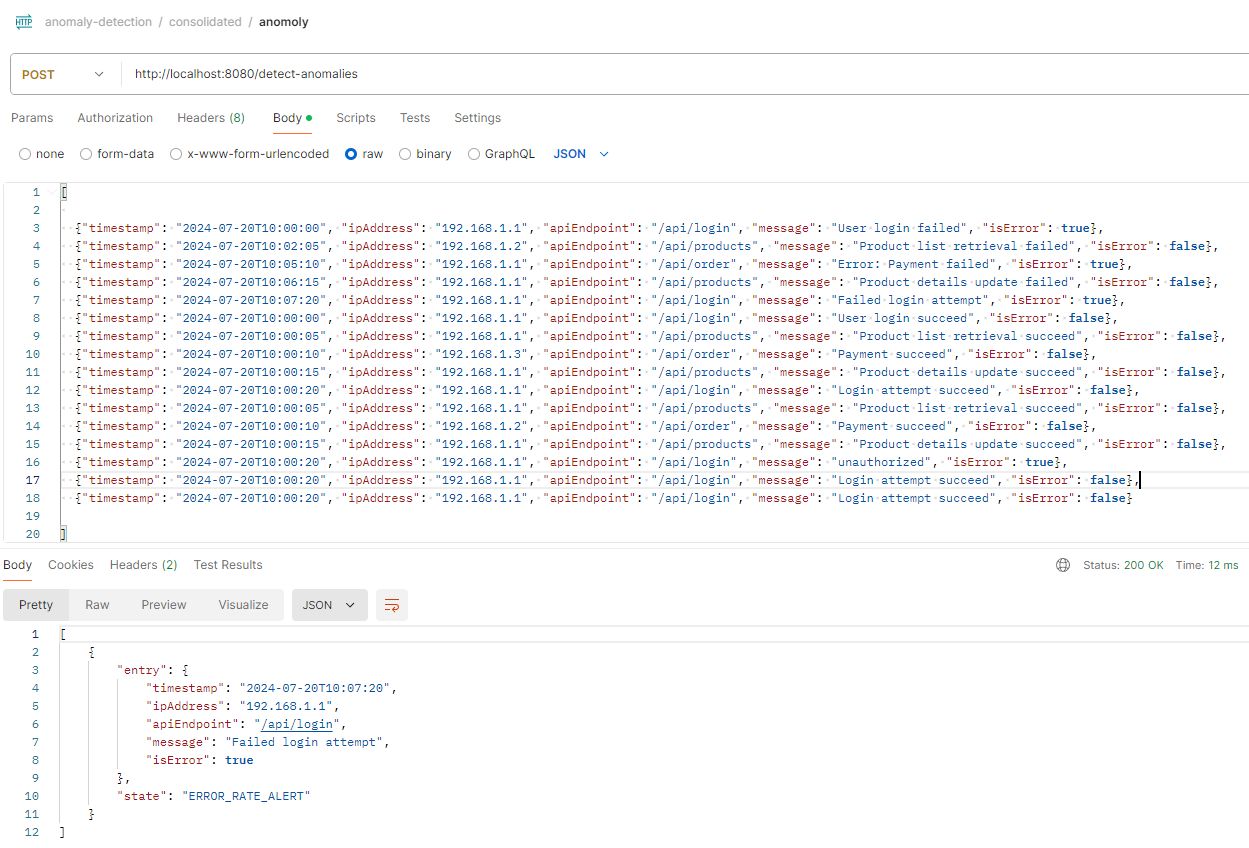
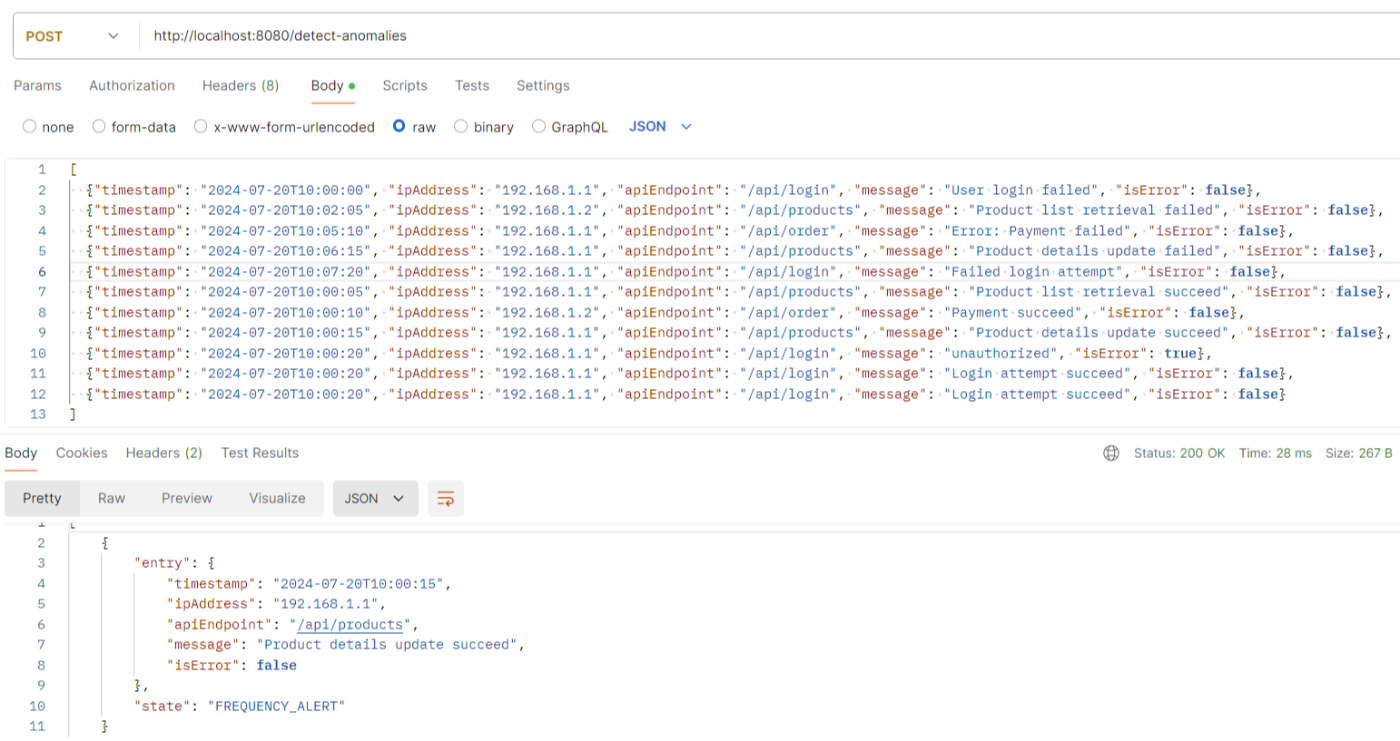
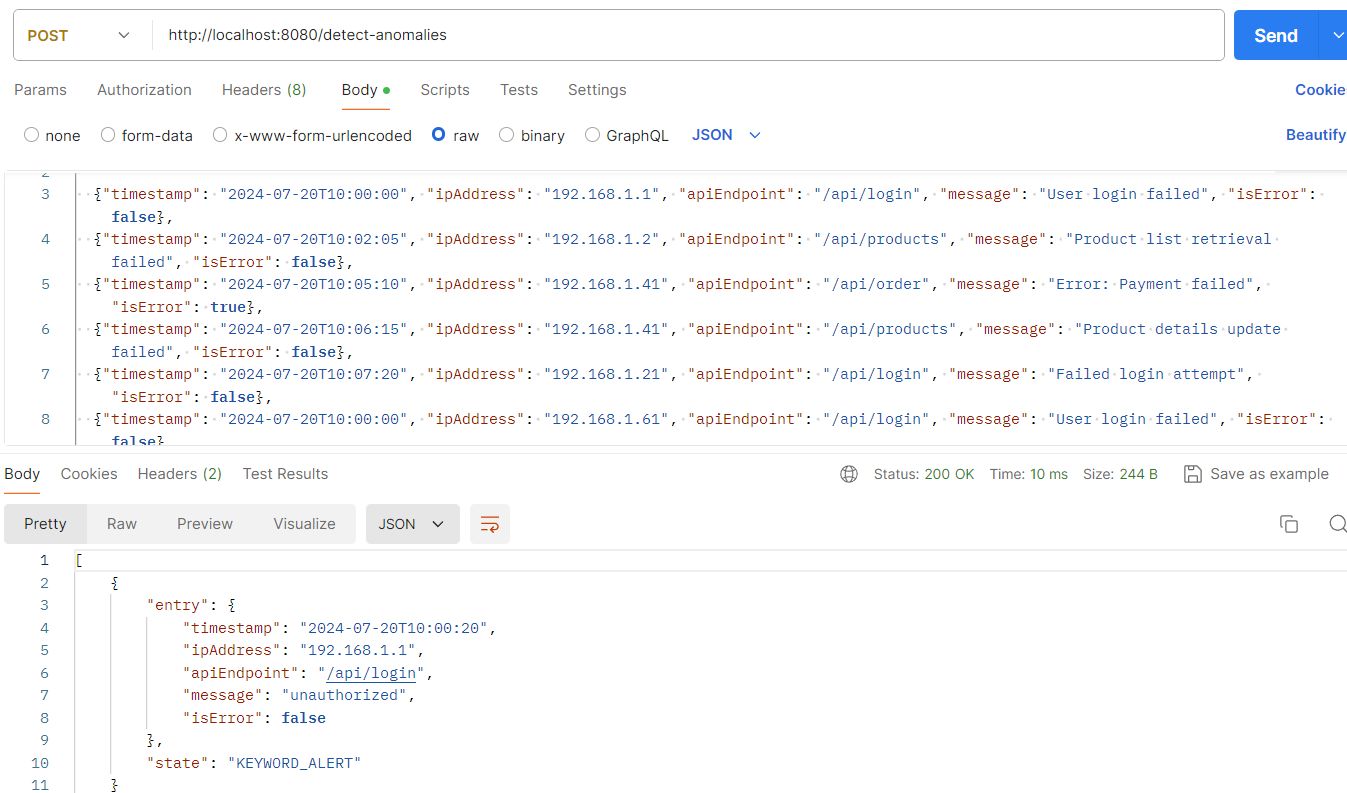
\ To evaluate the API's functionality, Postman can be used to simulate scenarios involving high traffic, high error rates, or suspicious keywords. If a specific IP address exhibits a high error rate, the system should trigger an alert. If high traffic originates from a particular IP, the system will block further transactions. Additionally, if the system detects suspicious keywords in a transaction, it will block that transaction as well.
\

Given below the sample payload where the system detects high traffic results in FREQUENCY_ALERT
\

Given below the sample payload where the system detects suspicious keywords results in KEYWORD_ALERT
\

Performance Consideration:
\ Managing backpressure and memory usage in reactive streams is crucial for building resilient and efficient reactive applications. Backpressure occurs when the rate of data production exceeds the rate of data consumption, leading to potential memory overloads and system instability if not handled properly.
\
Buffering:
Temporarily store incoming data in a buffer until the consumer is ready to process it. Be mindful of buffer sizes to avoid memory overload.
\
Dropping:
Drop the excess data that cannot be processed immediately. This approach is useful when missing some data is acceptable.
\
Latest & Greatest:
Keep only the most recent data and discard the older ones if the consumer is not able to keep up.
\
Error Handling:
Emit an error or signal to the producer that the consumer cannot handle more data
\
\ Conclusion:
\ In conclusion, our system proficiently identifies and reports anomalies in real-time.. By focusing on the core functionality of detection, we ensure that potential problems are flagged as soon as they arise, which allows for immediate intervention. However, while our current system excels at anomaly detection, we recognize the value of further enhancement.
\ Future enhancement include the integration of a notification system, which will significantly broaden the system's capabilities. This enhancement aims to facilitate the automatic dispatch of alerts to monitoring systems, ensuring that relevant personnel are informed without delay. Additionally, it will enable the triggering of automated responses to common issues, streamlining the process of issue resolution and reducing the need for manual intervention.
\
This content originally appeared on HackerNoon and was authored by Sreejith
Sreejith | Sciencx (2024-08-14T19:00:19+00:00) Traffic-Based Anomaly Detection in Log Files. Retrieved from https://www.scien.cx/2024/08/14/traffic-based-anomaly-detection-in-log-files/
Please log in to upload a file.
There are no updates yet.
Click the Upload button above to add an update.
