This content originally appeared on HackerNoon and was authored by Kliment Merzlyakov
\
Churn and Customer Lifetime Value
In this series of articles, I am going to shed some light on churn prediction and customer lifetime value usage through the following topics:
\
- Introduction to churn-a high-level overview of what it is, its common applications, and how you can easily calculate it.
- Introduction to LTV (customer lifetime value).
- An in-depth discussion of various approaches to calculating churn and LTV, including statistical models, survival analysis, and machine learning.
Terms
Let’s start by defining some common terms:
Recency — the number of days between the current date and the last purchase.
Tenure — the number of days between the last and the first purchases.
Lifespan — the number of days between the expected last and the first purchases. Unlike with tenure, we don’t know a current customer’s last purchase date, so we need to predict it (most likely using churn rate).
Churn rate — Generally, this refers to the percentage of customers who stop their relations with the company. Sometimes churn rate can be interpreted as a particular customer or group of customers’ probability of leaving. The churn rate is also the opposite of the retention rate, which is equal to 1 - churn rate.
Customer lifetime value (CLTV or LTV) — the amount of money a customer (or group of customers) brings to the company during their lifespan. LTV can be historical (or actual), expected (or predicted, future) or both (or overall). Alternatively, CLTV may be expressed in terms of gross profit.
Cohort — a group of customers who have one or several attributes in common. Most of the time, this attribute is the month of acquisition (sometimes it is the week or quarter). But it is not limited to time-based attributes. It can also be a marketing channel of acquisition or a combination of attributes.
\
Value for Business
Before going into calculation details, let’s discuss why churn rate matters in the first place:
- Attracting a new customer may be 5x more expensive than retaining an existing one. As such, your acquired customer base is the main driver of your business. If you have too many customers leaving, your unit economics will suffer significantly. Therefore, the churn rate should be carefully calculated, monitored and goaled.
- Accurate churn calculation is the foundation of LTV prediction. With your churn rate properly estimated, you can estimate the lifespan of your customers. Based on that, you can then estimate your future cash flows and your business equity.
- Churn rate can help you to target your marketing activities more effectively. For example, by trying to retain customers with a high churn rate (risk group) but high historical revenue (high-value group).
- Churn rate dynamics split by cohorts can highlight which business decisions were successful.
Ways To Reduce Churn
Not let's see some of the ways to reduce churn:
- Try to exclusively attract customers who are relevant to your product.
- Most customers churn during the trial or after the first purchase. Try to make onboarding and the introduction to your product as smooth as possible.
- Pay attention to your current active customer base. It has to be easy to contact your support. If you have a SaaS product, documentation should be accessible, etc.
- Remind customers about your product, but don’t be intrusive. A letter with a description of new features, new product announcements or a relevant post in your blog can help with this.
- Ask your customers why they left or unsubscribed. You can discover the main drivers for churn, whether it is delivery issues, lack of particular features or price.
Churn Calculations
There are at least three approaches to calculating churn:
- General for the entire active customer base
- Separate for each cohort
- Individual for each customer
\ The first approach to calculating churn rate (CR) is straightforward. We only need three numbers for it:
- The active customer base at the beginning of the period (e.g. start of the month). That would be Customers0 in the equation below.
- The active customer base at the end of the period (e.g. end of the month). That would be Customers1 in the equation below.
- The number of new customers for the period. That would be NewCustomers in the equation below.
\

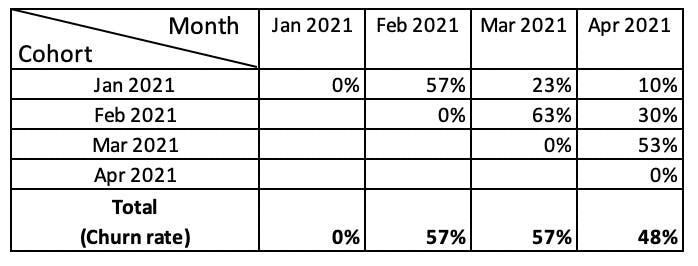
\ For example, if you had 21,000 customers at the beginning of April, 40,000 customers at the end of April and 29,000 new customers for April, then your churn rate for April would be (21,000 — (40,000–29,000) ) / 21,000 = 0.48 or 48%. This is a good start for understanding your customer base and churn rate is a valuable metric to track in your reports. Once you monitor it, you can see whether it changes over time and whether your actions affect it.
\ However, this approach has a downside, as we are mixing all the active customers into one basket. To illustrate this potential pitfall, consider that customers with a two-month tenure (relatively new) likely have a much higher churn rate than customers with one-year tenure. Moreover, relatively new customers can have different behavior patterns. They could have been attracted through other marketing channels, which means their churn dynamics can be significantly different.
\
To tackle this problem, we can use the second approach to calculating churn rate: cohort-based.
In this approach, the idea is to attribute all customers to the month during which they were acquired and then calculate the churn rate separately for each month of acquisition. The month (or any other period) of acquisition is called a cohort.
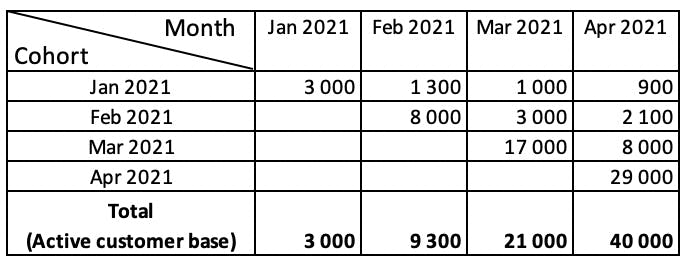
\ Let’s describe the calculations using a synthetic example of some e-commerce shop. For simplicity, let’s assume that this business was founded four months ago. In table #1, we have the number of customers split by cohort. Each row represents dynamics for one cohort and each column represents a slice of our customer base for a particular month. From this table, we can see the overall number of customers, new customers and retained customers monthly. Our active customer base resembles a pie with detailed layers for each cohort.
The advantage over the first approach is that we can still calculate the general churn rate from this table, but we can get churn rates for each cohort separately as well. The cohort’s churn rates are calculated in table #2. Now we can see that the 48% churn rate for April consists of 10%, 30% and 53% churn rates for the first, second and third months, respectively. Pretty different, right?
\
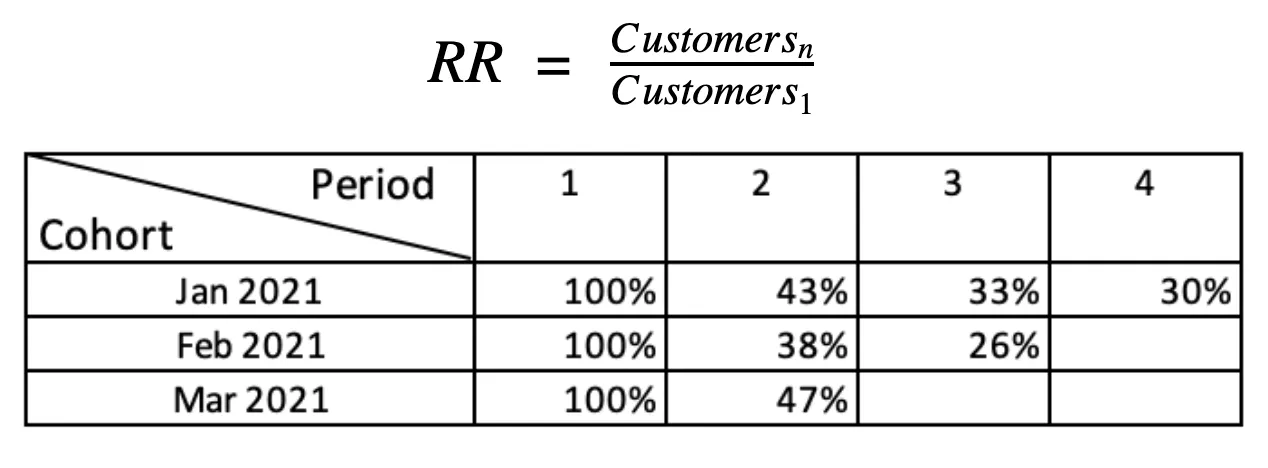
With this one simple change, we can begin comparing apples to apples. Instead of looking at calendar months in columns, we can look at the cohort’s life month (the number of months since acquisition) such that March 2021 will become the first, second and third periods of life for the March, February and January cohorts, respectively. By rearranging the table in this manner, we arrive at table #3. Now we can see that for some reason, the February cohort retained much worse than the January and March cohorts. You can dig deeper and investigate what the root cause of this change was-promotions, acquisition of different types of customers, etc.
\ It is good to remember that it is not necessarily a bad sign. For example, it is common to observe increased churn during periods of high growth.
The last thing worth mentioning in the cohort-based approach is that we can additionally calculate retention curves for our customers. This is shown in table #4. From these curves, you can understand that you commonly keep only ⅓ of your customers in the third month. The formula for retention rate (RR) is shown below, where Customersn is the number of customers on the period n for this cohort. Customers1 is the number of customers in this cohort (also referred to as a cohort size).
\

The third approach to calculating churn rate is to do it individually for each customer. Although this is a much harder task to accomplish, it opens up a wide range of opportunities for handling your customer base.
\ You can do this based on some simple heuristics. For example, customer A is in cohort January 2021 and this is the fourth month of life for that cohort. From the historical data, we know that, on average, X% of customers active in the fourth month stop being active in the fifth month. Then customer A has an X% churn rate (i.e., an X% probability of stopping activity in the next month). This is an artificial example. The actual individual churn models are much more complicated, but you can get a general sense of how it works from it. The idea here is to use historical data about your clients to predict the probability of being active in the following period.
\ You have many options when going the individual route. For example, the model can be based on average heuristics (as illustrated above), statistical models such as Pareto/NBD, survival analysis models or machine learning models. There are so many choices and nuances, so I will cover this topic in greater detail in a future blog post.
\ Accurate individual churn rates have many advantages over general ones:
They have a prediction ability. Suppose social media traffic has much lower churn rates and you attracted a lot of customers through social media this month. If you have an accurate churn model, you see the drop in churn rate immediately. You don’t need to wait another month to calculate the actual churn rate.
They allow you to work with your customer base more granularly. For example, by targeting promo activities only on the customers with the highest churn rates.
They provide an ability to accurately predict the lifespan of the customers and thus lifetime values for your customers and the whole business (more on that in the LTV blog post).
In addition, we can still determine the general level by calculating the average churn rate across all active customers (which is often more accurate than a general churn rate estimation).
\
When we are building a model for individual-level churn rates, we need to work with definitions. What is the churn period for our business? If we did not see any activity from a customer, is it a good time to mark them as a churn? Here are some clues on how we can define it:
What is the average/median/n-quantile lifespan of the current customers? You can use this number as is or as a starting point and then add some arbitrary number to it to be sure that you are not marking customers with a churn flag too early. Calculate it carefully, as you don’t want to have different customers’ cohorts in one chunk. If somebody made their first purchase a week ago, that doesn’t mean their lifespan is seven days. That is why it is better to split your customers into cohorts and calculate an average lifespan for the oldest cohorts.
\
If you have a subscription-based business, then the unsubscribing event is the most obvious definition of churn. Keep in mind that if you have a mixed model where customers can purchase with or without a subscription, then unsubscription is not necessarily churn. The customer may have simply decided to temporarily switch to one-time purchases or to take a short break, but they are still an active customer for your business.
\
Frankly, there is no ideal approach to churn definition. One way or another, you will have false positives. There will be customers who were marked as churned based on your definition, but they will suddenly become active again. As you cannot avoid having this group, you can name it as reactivated customers and start to track them as another metric for your customer base. But for churn analysis and LTV prediction, you can put it aside and move forward. Just make sure this reactivated customer group is not huge and try not to forget about it completely in your customer analytics reports.
\ Keep in mind that you can have unregistered customers (a quick checkout). In such cases, you can either try to stitch their orders through some secondary attributes or analyze them separately.
\ This blog post was an introduction to churn rate prediction. In the following posts, I will cover how churn rate is related to LTV in greater detail and which data science approaches can be used to predict churn rates and LTV.
\
This content originally appeared on HackerNoon and was authored by Kliment Merzlyakov
Kliment Merzlyakov | Sciencx (2024-09-13T14:34:26+00:00) Understanding the Basics of Customer Churn. Retrieved from https://www.scien.cx/2024/09/13/understanding-the-basics-of-customer-churn/
Please log in to upload a file.
There are no updates yet.
Click the Upload button above to add an update.


